The Fed’s Inconvenient Truth: Inflation Is “M.I.A.”
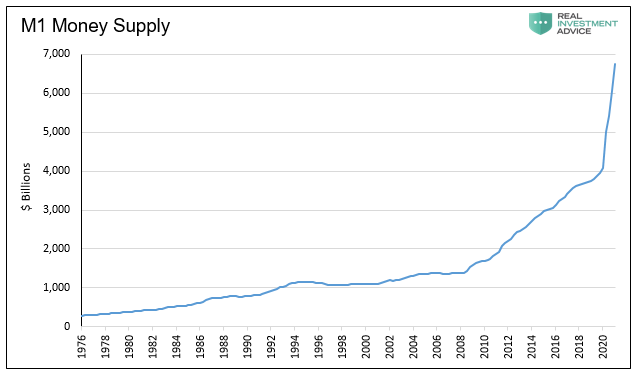
“The amount of money in the US economy is 25% higher than it was at the start of 2020, eclipsing any pace of money growth seen since the Federal Reserve was established (1913)” RB Advisors Deputy CIO Dan Suzuki.
In recent weeks we have seen a non-stop flow of ominous statements like the one above.
The author is 100% factual and it should be a cause for deep concern. Historically, such surges in the money supply were often met with significant inflation.
While the sharp increase in the money supply provides context to the depth of our economic problems, our inflation warning bells are not ringing, at least not yet. Here is why.
What is Inflation?
Inflation, or aggregate price increases, results from economic activity, along with the amount of money and its velocity.
A famous economic formula called the Monetary Exchange Equation uses those factors to create a mathematical identity that precisely determines the inflation rate.
We co-authored an article with Brett Freeze entitled Stoking The Embers of Inflation. The article went into great detail about the monetary exchange equation. We summarize a few key points here:
Per the inflation identity, the rate of inflation or deflation (%P) is equal to the rate of money growth (%M), plus the change in velocity (%V), less the rate of output growth (%Q).
%M – As noted earlier, the change in the monetary base is a direct function of the Fed’s monetary policy actions. To increase or decrease the monetary base, the Fed buys and sells securities, typically U.S. Treasuries and more recently Mortgage-Backed Securities (MBS).
%V – Velocity is nominal GDP divided by the monetary base (Q/M). Velocity measures people’s willingness to hold cash or how often cash turns over. Lower velocity means that people are hoarding cash, which usually happens during periods of economic weakness, credit stress, and fear for banking institutions’ going-concern.
So if we exclude GDP, inflation is dependent on money supply and velocity changes. Money supply data is published weekly and easily forecastable with the Fed’s QE schedule. Velocity, on the other hand, is posted once a quarter and much more challenging to forecast. As such, let’s dive into velocity.
Understanding Monetary Velocity
Velocity is a measure of how fast cash circulates in an economy.
We consider two extreme examples of money printing and monetary velocity to appreciate the interaction of money supply and velocity.
- The Fed prints $10 trillion and buries it in a hole.
- The Fed prints $10 trillion, sends each American a $30,000 check, and tells them they have five days to spend it or lose it.
The two examples have polar opposite effects on prices, despite the same massive increase in the money supply.
In example 1, the Fed does not affect inflation. The $10 trillion is not fungible as long as it stays buried.
In example 2, hyperinflation would result as the new money rapidly circulates through the economy and dwarfs the economic system’s production capacity. Essentially, the demand for goods and services outstrips the supply.
The amount of money greatly matters, but equally important is how it moves through the economy. The graph below compares the money supply chart above with the velocity of money and inflation.
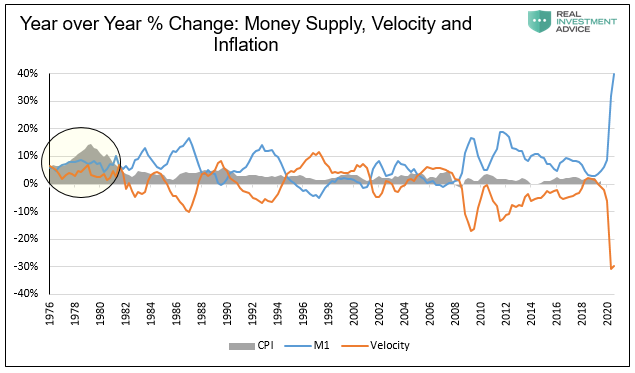
When you view money supply and velocity together, one notices they tend to offset each other. However, we highlight the late 1970s, the last highly inflationary period, to show a period they did not counteract each other.
Velocity Trends
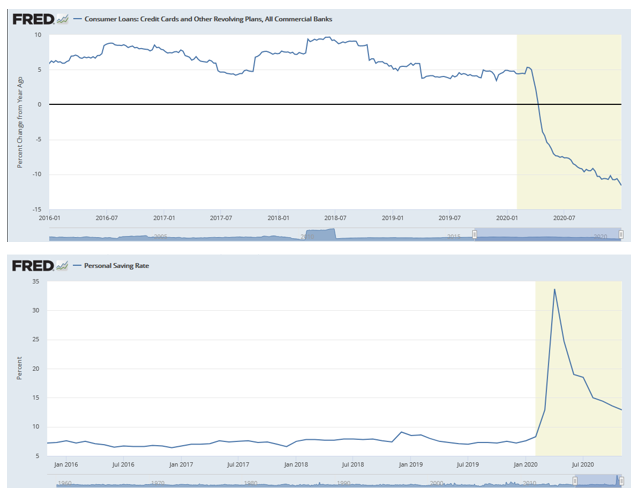
Currently, monetary velocity is plummeting. Despite the surge in money supply, the money is not circulating as fast, as a percentage of the economy, as it was before COVID. To help us understand why we first focus on the consumer. Consider the recent trends in revolving credit debt outstanding and savings rates shown below.
The next chart shows the sharp rise in the Fed’s balance sheet and the commensurate increase in the Federal deficit.
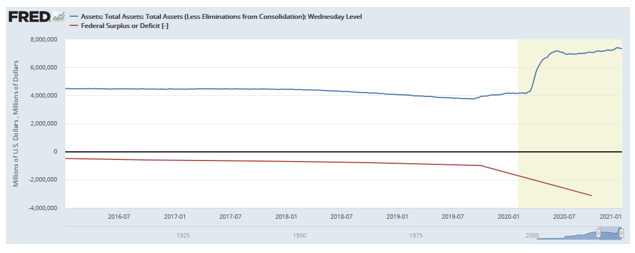
The deficit data (red) is not current on the graph, but if it were, you would see that the Fed’s balance has risen perfectly in line with the deficit. Said differently, the surge in the money supply is indirectly funding the government.
If the government spent all the money it borrowed and the recipients of the money spent it, velocity and GDP growth would be much higher. As a result, prices would likely be higher.
The problem is not only frugal consumers but, believe it or not, the U.S. Treasury. The graph below shows Treasury’s cash balance, held at the Fed, is over $1.5 trillion more than average. The treasury essentially funded over $1 trillion, backed by a higher money supply, which it has yet to spend.
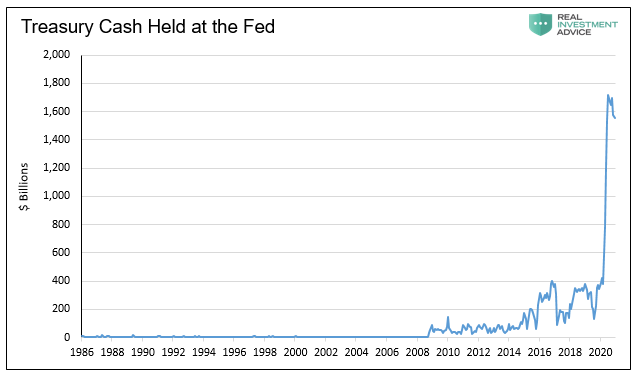
Remember our non-inflationary example where the Fed prints money and buries it in a hole? About a third of the $3 trillion the Fed added to the money supply is in a hole. Like consumer savings and debt repayments, the Treasury’s activities are weighing on velocity.
An Inconvenient Truth For The Fed
Per the inflation identity, the rate of inflation or deflation (%P) is equal to the rate of money growth (%M), plus the change in velocity (%V), less the rate of output growth (%Q).
Velocity, therefore, equals GDP divided by the money supply.
The rate of velocity at the end of the third quarter of 2020 is 3.92. Assuming a 5% GDP growth in the fourth quarter, we should see velocity fall to 3.28. Note, we know the money supply rose by $1.1 trillion in the fourth quarter. The annual percentage changes in M1 and velocity will approximate a 65% advance and decline, respectively.
Herein lies an inconvenient truth for the Fed. They are boosting the money supply, and it’s having an equally negative effect on velocity. As such, it’s hard to forecast much inflation given current Fed policies.
To quote John Hussman- “Once short-term interest rates drop to zero, further expansions in monetary base simply induce a proportional collapse in velocity.”
Monetary Equation versus Reality
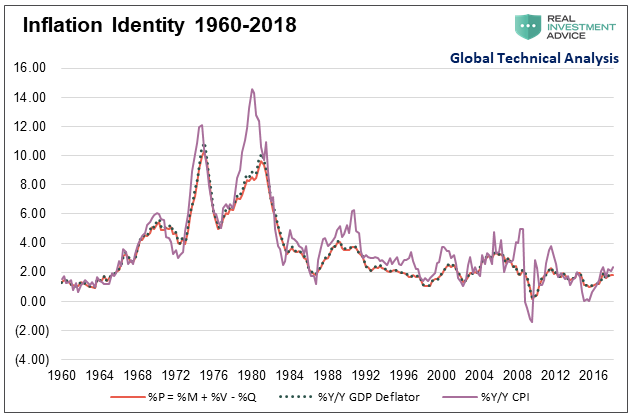
We think it’s helpful to briefly segue and show how well the monetary equation holds up in the real world. The graph below is from our article mentioned above. As shown below, solving for inflation using the equation ties out nearly perfectly with the GDP price deflator and is well correlated to CPI.
CPI is a flawed construct as it is impossible to get accurate prices on all transactions. Further its equally impossible to properly weight them based on consumption trends. As such, CPI rises and falls more than the deflator or the output of the equation. Since 1948 CPI has averaged .4% higher than the deflator/equation with a correlation of 95%.
Summary
The Fed pushed the money supply higher by nearly $3 trillion or 70% throughout 2020. At the same time, GDP is $600 billion less than it was at the beginning of 2020. As a result, velocity has sharply declined.
GDP is recovering nicely but remains below levels of a year ago. The Fed expects to push the money supply higher at a 15% rate this year. All else equal, velocity will likely further decline and offset the money supply growth.
While we are not concerned about inflation today, we offer caution for tomorrow. The Fed and Treasury are playing a dangerous game. The numbers we discuss above are massive and dwarf anything seen in American history. If consumers start spending their savings, and the government keeps borrowing and spending unprecedented amounts, velocity can pick up rapidly. We leave you with a vital question to better understand the prospects for inflation.
Will the Fed have the wherewithal to reduce money supply growth if velocity increases?