by Dana Lyons

An abundance of New 52-Week Highs AND 52-Week Lows has been a warning in the past.
Today’s Chart Of The Day looks at a phenomenon that we’ve highlighted in the past on several occasions and which we have termed, “the Junkie Market”. The idea is a simpler offshoot of the notorious “Hindenburgh Omen”. Essentially, it describes a condition in which there are relatively large numbers of both new 52-week lows and new 52-week highs. In the past, such occasions have often occurred within close proximity of market tops.
As today’s chart reveals, we just experienced a relatively elevated number of both new highs and new lows – over 100 to be exact – on both the NYSE and Nasdaq exchanges.
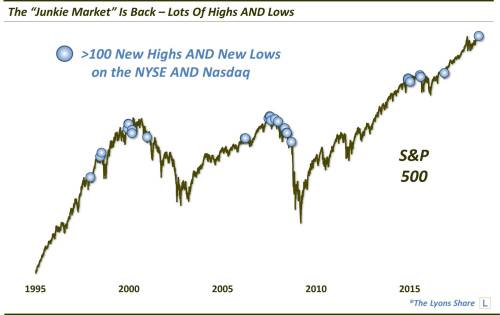
As the chart shows, similar past occurrences, at times, took place near important market tops. So is the current episode indicative of a market top? Or will the market trample over this phenomenon as it has most “red flags” in recent years?