Authored by Lance Roberts via RealInvestmentAdvice.com,
Quick Takes
Market
While the market rallied last week and continues to flirt with all-time highs, not surprisingly, volume was exceedingly light because of the July 4th holiday on Thursday. As Carl Swenlin noted:
” SPY has formed a bearish rising wedge, and the VIX penetrated the upper Bollinger Band, which is short-term bearish. The wedge looks particularly weak because price rose off the bottom of the wedge this week, but it failed to reach the top of the wedge before touching the bottom of the wedge again today.”

With a majority of short-term technical indicators extremely overbought, look for a correction next week. What will be important is that any correction does not fall below the early May highs.
Furthermore, with participation continuing to narrow, it continues to look like the August/September time frame for a larger corrective cycle is still in play.
Such corrective actions would coincide with emergence of risk factors from trade, to disappointment from the Fed, to a disappointing earnings cycle and rising recessionary indications.
This doesn’t mean sell everything and go to cash. It goes suggest carrying some hedges, a higher than normal level of cash, and a rotation into “defensive” positioning will likely remain prudent.
Employment
The employment number on Friday was strong as we anticipated. This puts the Federal Reserve in a more difficult position with respect to cutting rates in July. The markets initially sold off on the news but did manage to stage a bit of recovery by late afternoon as “hope” remains high the Fed will cut rates regardless.
However, let’s take a look at a couple of “off the run” indicators about employment.
First, the Fed looks at the 3-month average of employment, still a lagging indication, to smooth out month to month variability. The chart is below:
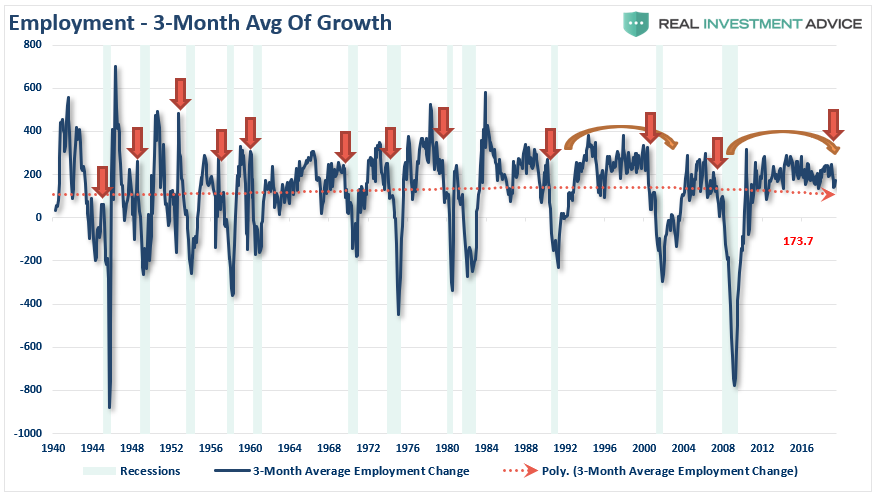
Clearly, not only has the trend turned lower as of late, but has been weakening since 2015. This is commensurate with a late-stage economic expansion. However, the current weakness has been consistent with previous ebbs and flows of the business cycle and is not currently “weak” enough to suggest cutting rates in July is warranted.
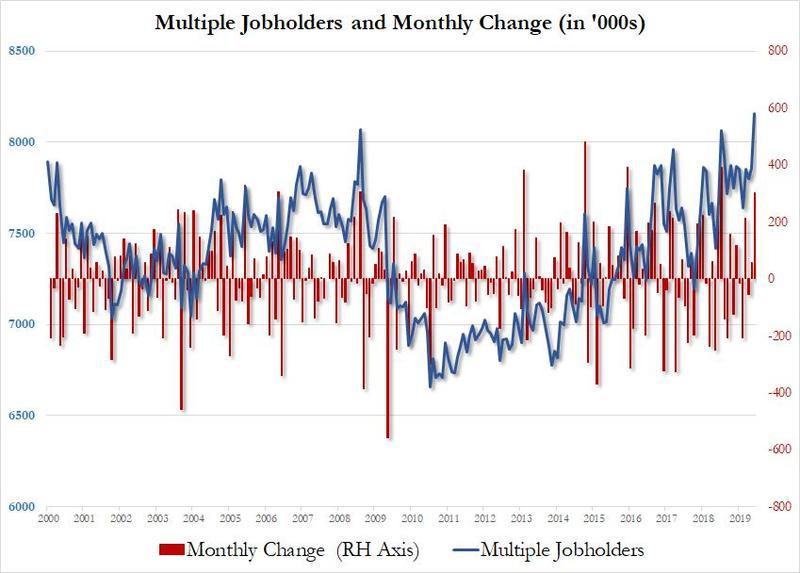
Second, the “quality of jobs” continues to deteriorate as shown by the surge in “multiple part-time job holders.” Per ZeroHedge on Friday:
“While the headline payrolls number was stellar, coming in higher than even the most optimistic Wall Street forecast, one aspect of today’s jobs report that will likely become a major talking point for Democrats and other critics of the Trump economy, is that the number of multiple-jobholders soared from 7.855 million to 8.156 million, a monthly surge of 301,000 – the biggest since July 2018, and an indication that the jobs number was far weaker than the headline represents if one excludes all those workers who represented two jobs to the BLS’ various surveys.”
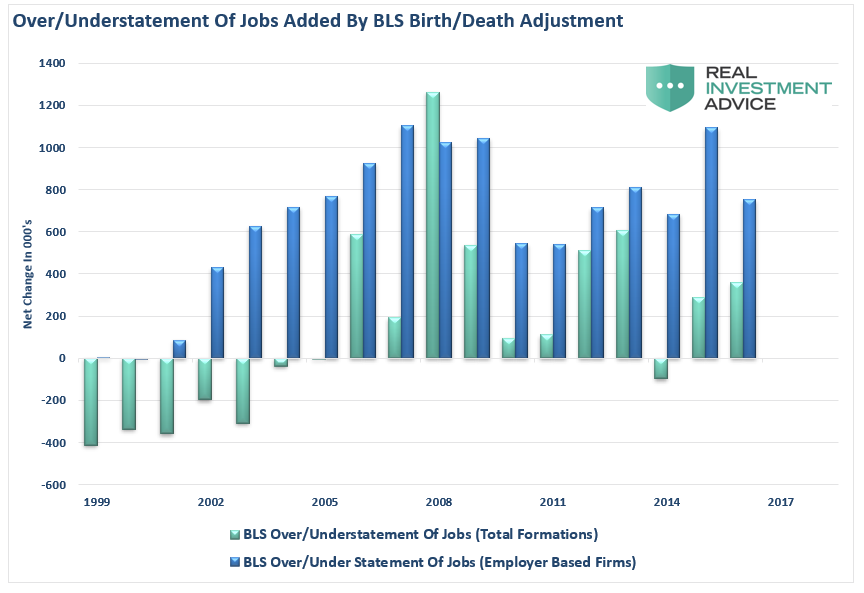
Lastly, the “birth-death adjustment” is, as we say in Texas, a “load of S***!”
Every month, the BLS adds numerous jobs to the non-seasonally adjusted payroll count to “adjust” for the number of “small businesses” being created each month, which in turns “creates a job.” (The total number is then seasonally adjusted.)
Here is my problem with the adjustment.
The BLS counts ALL business formations as creating employment. However, in reality, only about 1/5th of businesses created each year actually have an employee. The rest are created for legal purposes like trusts, holding companies, etc. which have no employees whatsoever. This is shown in the chart below which compares the number of businesses started WITH employees from those reported by the BLS. (Notice that beginning in 2014, there is a perfect slope in the advance which is consistent with results from a mathematical projection rather than use of actual data.)
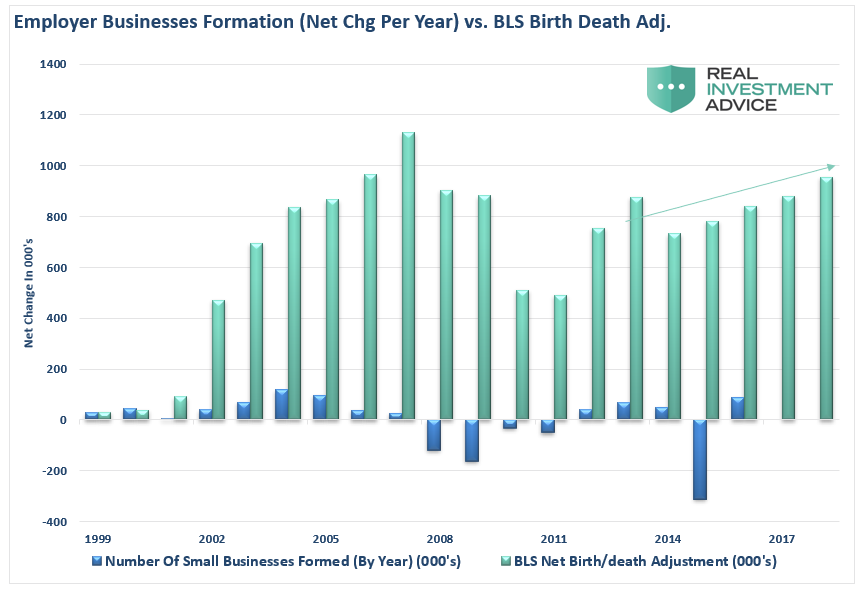
These rather “fictitious” additions to the employee ranks reported each year are not small, but the BLS tends even to overestimate the total number of businesses created each year (employer AND non-employer) by a large amount.
How big of a difference are we talking about?
Well, in the decade between 2006 and 2016 (the latest update from the Census Bureau) the BLS added roughly 7.6 million more employees than were created in new business formations.
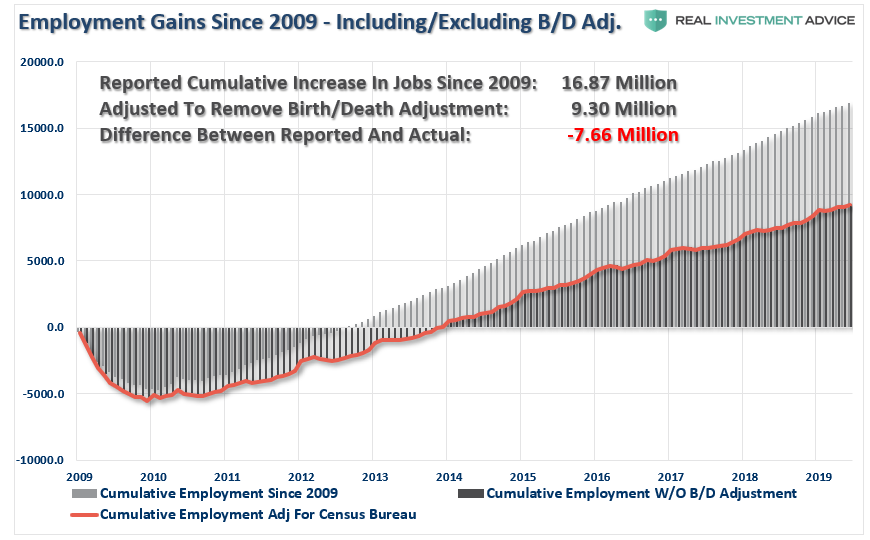
This data goes a long way in explaining why, despite record low unemployment, there is a record number of workers outside the labor force, 25% of households are on some form of government benefit, wages remain suppressed, and the explosion of the “wealth gap.”
However, while this data should concern you about the real strength of the economy, it is NOT data the Fed considers with respect to monetary policy decisions.
Volatility Warning
In the past we have spoken of the high-levels of complacency by investors in the market. As my friend Doug Kass recently pointed out, there are a litany of things investors should be concerned about:
- The U.S./China trade negotiations last weekend didn’t “move the ball forward.” The outcome was just as expected with no promise of a substantive deal in the near future. (The two sides remain quite far apart with regard to the core issues of intellectual property and technology transfer, among other debated items).
- The future U.S./China trade negotiations will not produce tangible results over the next 12 months.
- Global cooperation and coordination is at an all-time low
- Uncertainty of trade policy and the destruction of the post World War II political and economic order (in an increasingly flat and interconnected world) is consequential to future worldwide economic growth.
- The precipitous drop in global bond yields is a sign of an imminent contraction (relative to consensus expectations) in global economic and U.S. corporate profit growth.
- There is a lack of “natural share price discovery” in the face of monumental shifts in market structure (from active to passing investing.)
- The dominance of products and strategies that worship at the altar of price momentum raise the risk of a major “Flash Crash.”
- We are currently in an “earnings recession.”
- Unbridled fiscal spending has adverse consequences.
- There is over $12 trillion of sovereign debt having negative yields.
- Large levels of debt in the system raised the risk of a credit-related event if something “breaks.”
- The Federal Reserve (and other central bankers) can not catalyze economic activity (by lowering rates) from current low levels (“pushing on a string.”)
- The current low level of interest rates are an important factor in holding down business fixed investment.
- Current consensus economic and profit growth expectations will not be met in 2019-20.
- GDP growth cannot exceed the rate of labor growth and productivity.
- The recent downturn in high frequency economic data will be market impactful at some point.
Yet, despite all of this, implied volatility is flirting with record low levels.
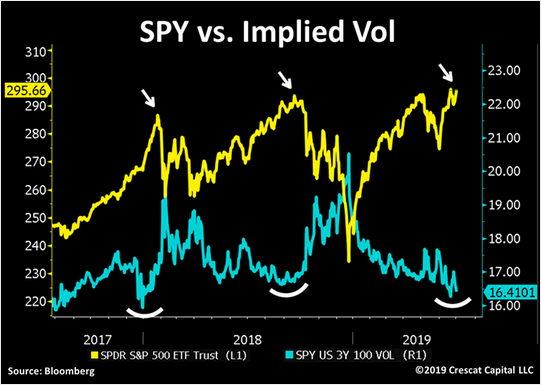
As the old saying goes: “What could possibly go wrong?”
As You Jump In, They Are Jumping Out
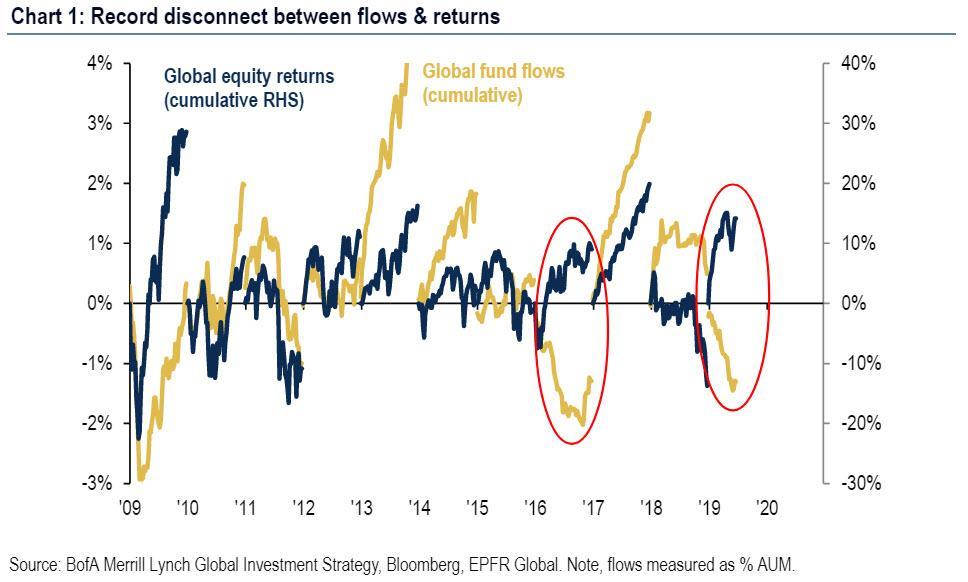
As the S&P climbs toward 3,000, individuals are clamoring to get in. Interestingly, while retail investors are chasing stocks, institutions continue to “de-risk” as $6.3B was allocated to bonds and $15.1B was pulled out of equities. The net result was a new record to date totaling $229B flowing into bonds, with $154B was pulled out of equities, according to Zerohedge.
“As BofA’s Michael Hartnett writes, there is now a record disconnect between flows & returns in 2019, with only 2016 a similar year in terms of outflows/returns.”
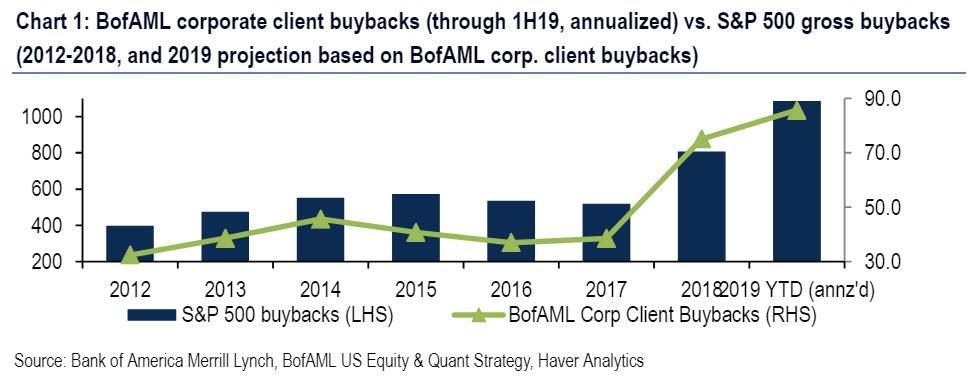
So, how is it that stocks remain near record highs? The primary culprit, as discussed previously, remains corporate buybacks which remain the primary source of market support in 2019. This is especially the case after US banks announced $129 bn in buybacks over the next 4 quarters.
Buybacks, according to BofA, are on pace for a record at $43B so far this year versus just $75B for the entirety of 2018. This suggests a record of over $1 trillion in S&P 500 buybacks for 2019.
Of course, the only reason retail investors own stocks at all is because the media tells them to.
After all, if you aren’t at the “casino table” you are missing out. Right?
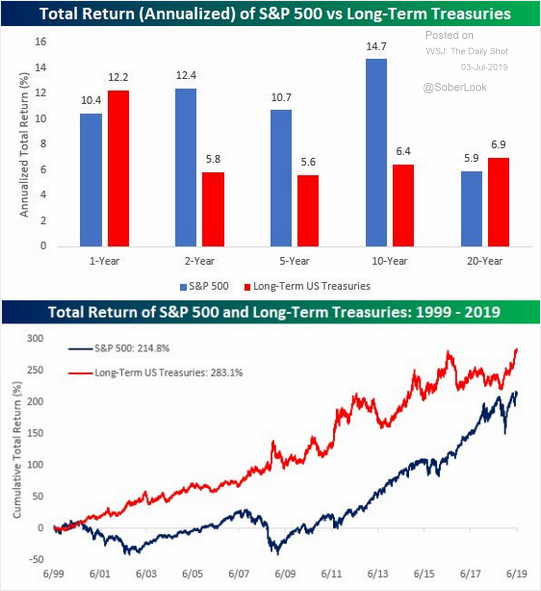
One thing you might want to ask yourself, if you indeed believe the former, is why “rich people,” own more bonds than stocks generally speaking?
If buybacks are indeed supporting market performance, it is worth noting that such support can be turned off like a water spigot.
Which means someone is going to be left “holding the bag.”
Just make sure it isn’t you.