On Wednesday, after the Dow plunged 608.01 points, I wrote a piece called “The #MAGA Stock Market Trendline Is Broken” in which I showed how the U.S. stock market’s sharp decline caused several major stock indices to break below their important uptrend lines that have formed in early-2016. I described this breakdown as a “very important change of trend.” On Thursday, the Dow rose 399.95 points and the S&P 500 rose 49.46, but I said that the market bounce did not negate the bearish technical developments that took place on Wednesday. Sure enough, the Dow fell 296 points or 1.2% on Friday, while the S&P 500 fell 1.7%, which confirms the technical breakdown under the important trendline that formed in early-2016 (I was waiting for a solid close below this level on the weekly chart).
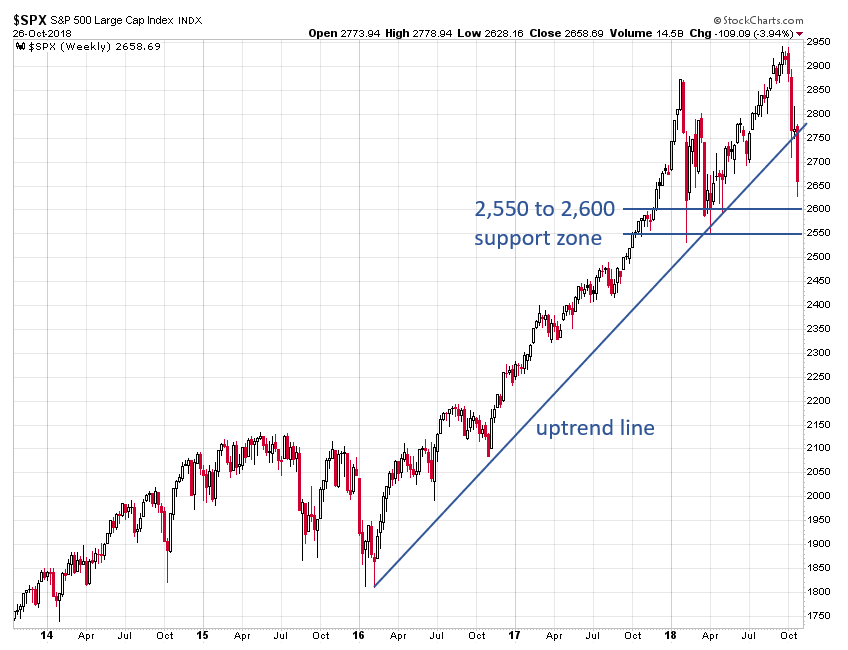
This week’s sell-off caused the S&P 500 to break below its uptrend line that began in early-2016. The next major technical support and price target to watch is the 2,550 to 2,600 support zone that formed at the lows earlier this year.
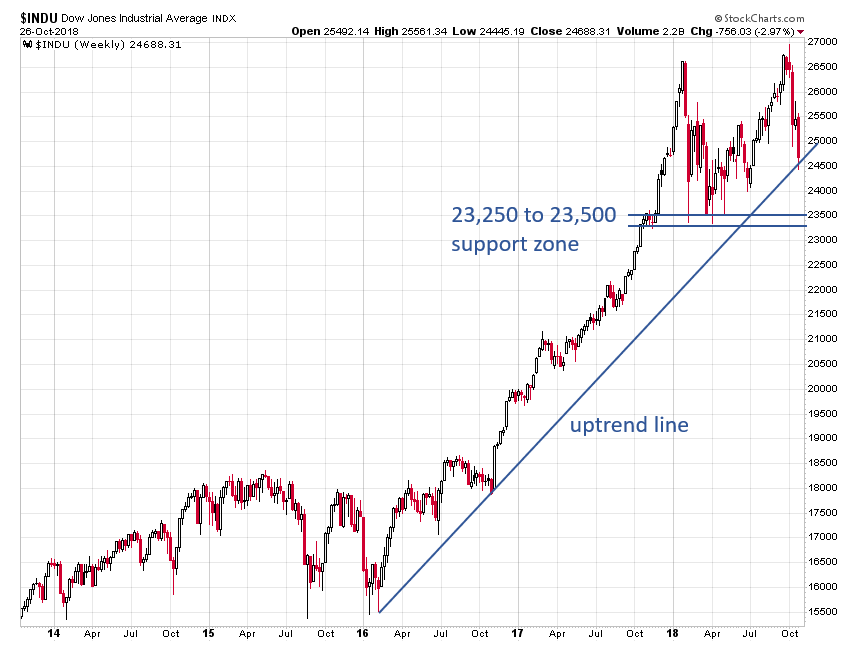
Unlike the S&P 500, the Dow Jones Industrial Average still has not broken below its key uptrend line. If the Dow closes below this uptrend line in a convincing manner on the weekly chart (possibly next week if the sell-off continues), the next important support level and price target to watch is the 23,250 to 23,500 zone that formed in early-2018.
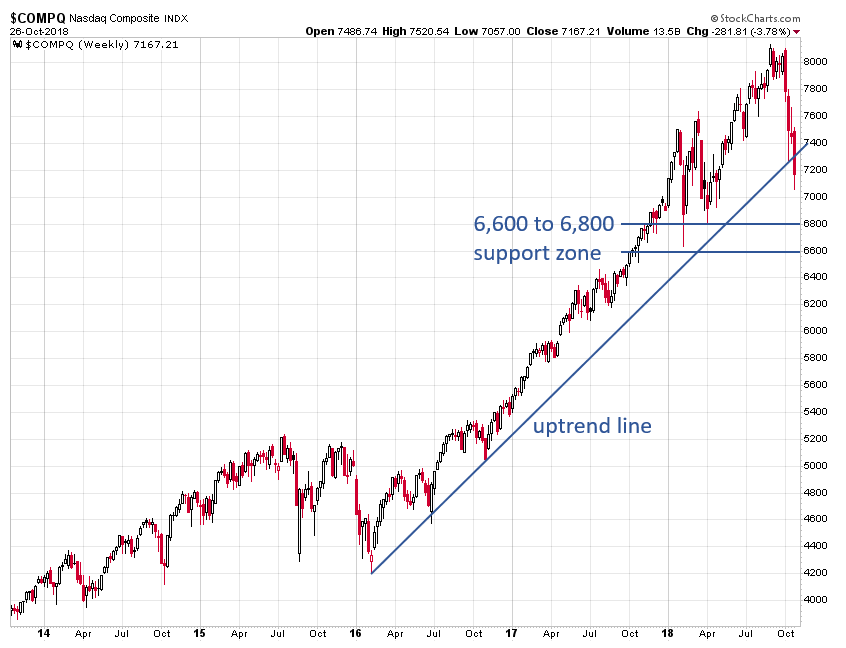
The Nasdaq Composite index closed below its uptrend line that began in early-2016. The index would need to close back above this trendline to negate the bearish technical signal. If the sell-off continues, the next price target to watch is the 6,600 to 6,800 support zone that formed earlier this year.
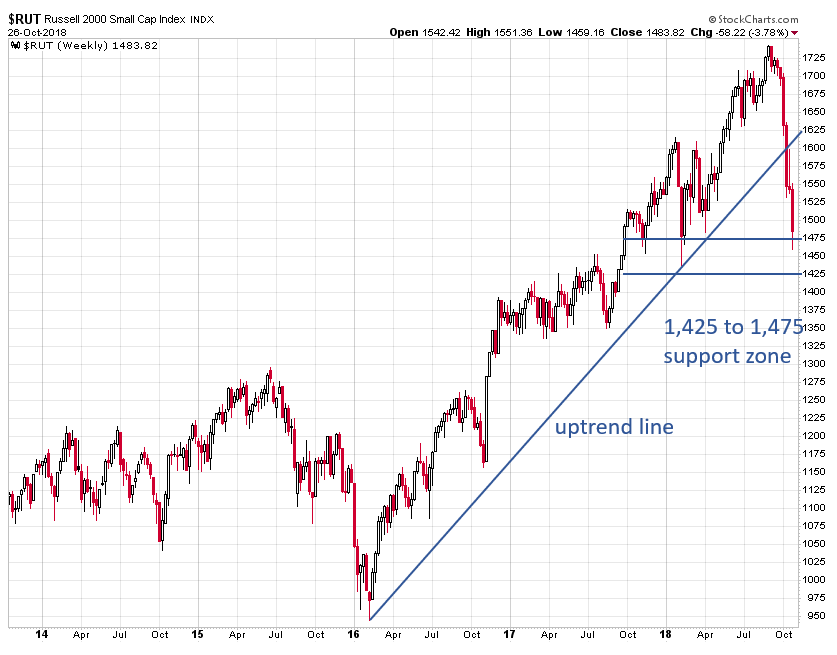
The small cap Russell 2000 index broke below its uptrend line two weeks ago and tested the 1,475 support level this week. If the index breaks below the 1,425 to 1,475 support zone, it would give yet another bearish signal.
As someone who is warning about a dangerous stock market bubble (please watch my presentation to learn more), this week’s technical breakdown really concerns me. The U.S. stock indices discussed in this piece would need to close back above their trendlines to negate this week’s breakdown. There is a very good chance that the sell-off will continue until U.S. stock indices hit their support zones at the early-2018 lows, then they will bounce for a time, and attempt to break below their support zones. If and when the indices eventually close below their support zones, that would give yet another bearish signal that would likely foreshadow a decline to their 2015 highs (not that the bear market will stop there, but it’s the next step after a break below the early-2018 lows).