Wolf Richter wolfstreet.com, www.amazon.com/author/wolfrichter
Vancouver prices drop. Toronto down 3.7% from peak, flat for 10 months. Winnipeg plunges most since at least 1990. Quebec City flat for 6 years.
In Greater Vancouver, BC, Canada, house prices fell 0.4% in April from March, the ninth month in a row of month-to-month declines, according to the Teranet-National Bank House Price Index. The index is down 4.7% from the peak in July 2018, the sharpest nine-month decline since July 2009. And it’s down 2.8% from April last year. One of the most splendid housing bubbles in the world is now deflating before our very eyes, after prices had skyrocketed 316% from January 2002 to the peak in July 2018 – meaning prices had more than quadrupled
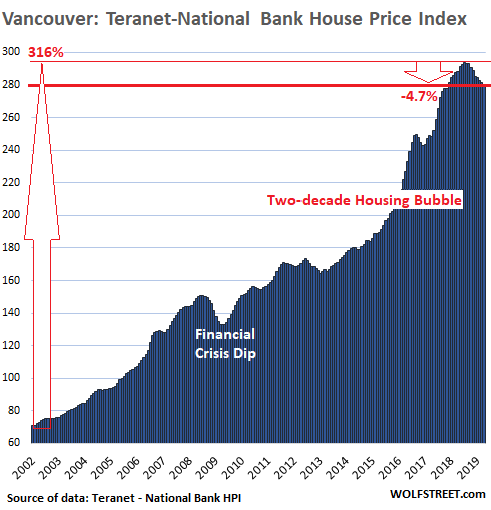
The Teranet-National Bank House Price Index tracks single-family house prices, based on “sales pairs,” comparing the sales price of a house in the current month to the last sale of the same house years earlier (methodology). Using “sales pairs” eliminates the issues that affect median and average price indices but has its own limitations. These median and average house prices, which are much more volatile, are now showing much sharper price declines for Vancouver.
Because the Teranet index uses a similar methodology of “sales pairs” as the S&P CoreLogic Case Shiller index for US housing markets, the indices produce comparable metrics. So let’s compare Vancouver’s housing bubble to the also deflating housing bubble in the San Francisco Bay Area. Splendid v. Splendid. The chart below shows the data of Vancouver (black columns) and San Francisco (red columns), with both indices converted into “percent change from January 2002.”
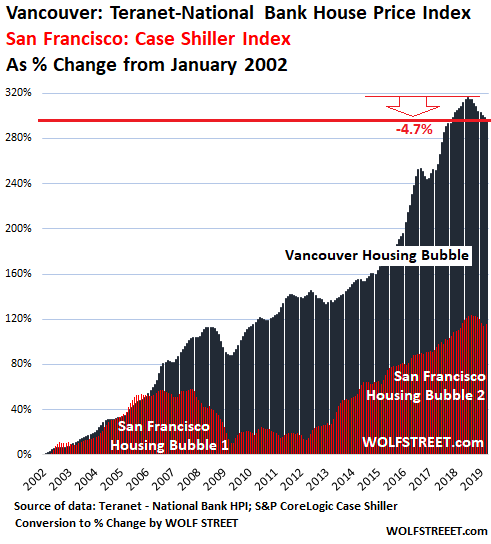
As the chart above shows, Vancouver’s housing market dipped briefly during the Financial Crisis while San Francisco’s market went into a hard four-year downturn, as the US housing bust morphed into the Mortgage Crisis that contributed to the Financial Crisis.
Toronto:
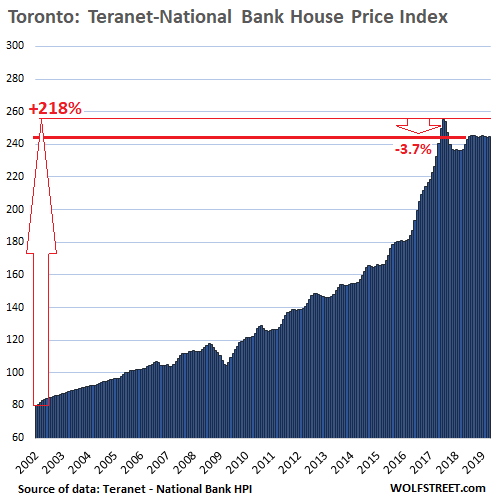
The House Prices Index for the Greater Toronto Area (GTA) ticked up 0.3% in April from March, after three months in a row of declines, but was down 3.7% from the peak in July 2017. Since July 2018, the index has been essentially flat.
From January 2002 through the peak in July 2017, the index skyrocketed 218% — in other words, house prices more than tripled in 16 years, a pale imitation of Vancouver’s house price bubble, where the index had more than quadrupled. The charts are the same scale, so the Toronto chart below has more white space. Note the crazy two-year spike through July 2018, when year-over-year gains maxed out 40%. Just nuts:
Winnipeg:
The house price index for the Winnipeg metro area dropped a steep 2.0% in April from March, and is down 4.2% from the peak in September 2018, the steepest seven-month decline in the data going back to 1990! The index is now below where it had first been in July 2016. The chart is on the same scale as Vancouver’s chart, so note the white space, in comparison:
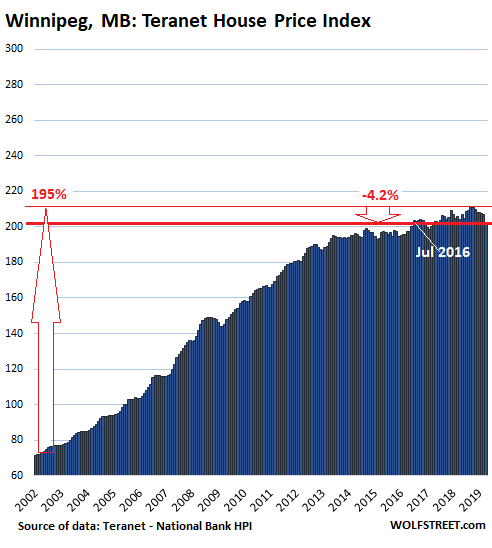
Winnipeg is a perfect example of why housing bubbles are by definition irrational – and no matter how hard you try to rationalize them, they remain irrational. Unlike Vancouver and Toronto, the Winnipeg metro is not huge (population of about 800,000), and there is plenty of land around it. The biggest city nearby is Grand Forks, North Dakota, USA, connected by a straight highway south through beautifully wide-open land.
And yet, the house price index had soared 195% from January 2002 through September 2018 – meaning that prices had nearly tripled in 16 years. Or if you squint a little, you see that the index first nearly reached that level back in November 2014. So, it nearly tripled in those 12 years!
And during the Financial Crisis in the US, Winnipeg’s house prices just hiccuped for a few months before going on their merry way higher. None of the hackneyed rationalizations of housing bubbles apply, and yet, it had a housing bubble.
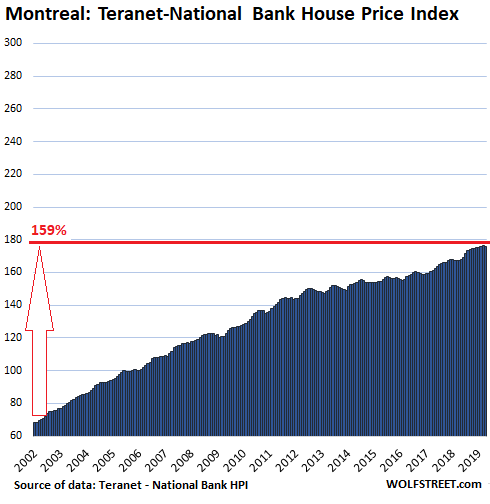
Montreal:
Home prices in the metropolitan area of Montreal inched down in April from a record in March and are flat for the three-month period, according to the House Price Index. The index is up 159% from January 2002. Even during the Financial Crisis, the index didn’t dip. But this 159% gain in 16 years doesn’t measure up to Vancouver’s crazy housing bubble; and white space is dominating the chart:
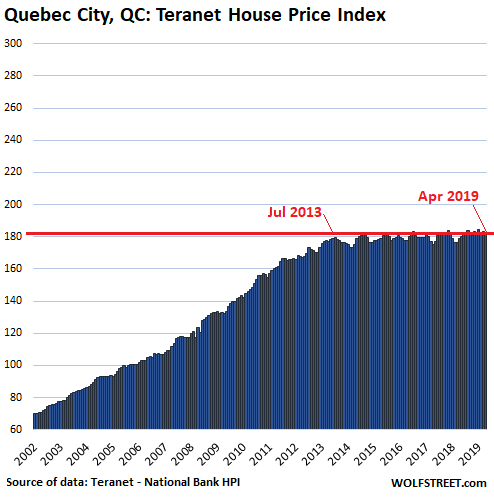
Quebec City:
The house price index for the Quebec City metro ticked down in April from March, continuing its up-and-down game that it has assiduously played since mid-2013, essentially going nowhere for six years, after a blistering 159% increase in the 11+ years from January 2002 through July 2013:
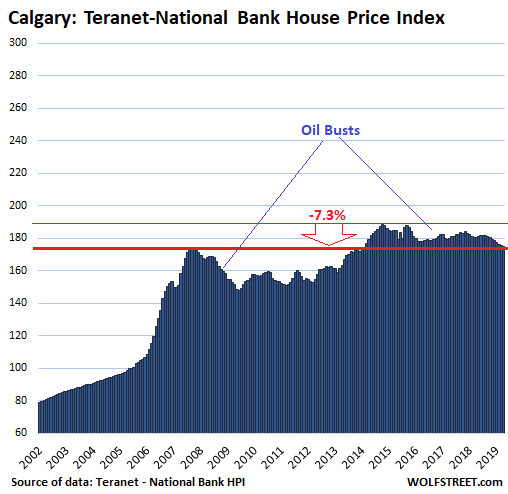
Calgary:
Oil booms and busts dominate the Calgary housing market. When the price of oil surges for years, the housing market booms. When the price of oil enters one of its infamous multi-year plunges, the housing market fizzles. This time around, the price of oil started its collapse in mid-2014, and the House Price Index reacted with a lag of a few months. The index peaked in October 2014, up 140% from January 2002. Then the index followed oil lower.
In April, the index fell another 0.3% from March, is down 7.3% from the peak in October 2014, and is back where it had first been in July 2007, 12 years ago. It remains up 123% from January 2002, a mere fraction of Vancouver’s 316% gain, and white space has taken over the chart:
As always with these house price indices that are based on “sales pairs” – whether the Teranet-National Bank House Price Index in Canada or the S&P CoreLogic Case Shiller index in the US: They measure the purchasing power of the dollar in a local market with regards to the same house over time. When the price of a house doubles, the house doesn’t double in size or become twice as opulent (normally, though there are exceptions). What has changed is the purchasing power of the dollar with regards to houses. This turns these indices into a measure of house price inflation, just like other indices are a measure of consumer price inflation. And in some cities in Canada, but not all, house price inflation spiraled completely out of control — and is now reversing bit by bit.