by Dana Lyons

U.S. stocks are testing perhaps the most important line in the entire market.
If you’ve followed us for any length of time, you know that our favorite equity market index is the Value Line Geometric Composite (VLG). As a refresher, the VLG tracks the median U.S. stock performance among a universe of roughly 1800 stocks. It is our favorite, therefore, as it is a solid measure of the health and direction of the overall market. And, as we have also said many times, it is helpful to track it because research has shown that 70-80% of the determinant of the trend direction of a particular stock is based on the trend of the overall market. It is also especially compelling to us currently, however, due to the proximity of prices now from a historical basis.
So what is so significant about the current VLG level? We have written about it several times recently, even naming it our Chart Of The Year for last year. Let’s recap.
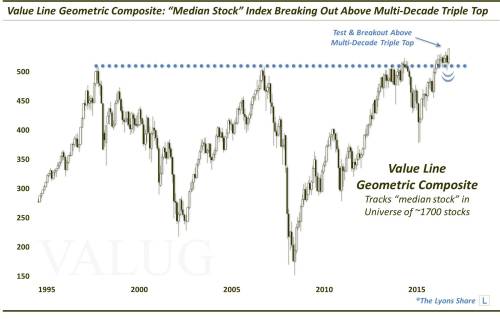
In 1998, the VLG topped out at an all-time high level around 510. 9 years later, in 2007, the index again topped out ~510. Fast forward 7 years and we see the index (briefly) top out there one more time in 2014. At the market top in mid-2015, the VLG was finally able to exceed the 510 level — temporarily. After a false breakout, the VLG sold off hard in the subsequent correction. Finally, in 2017, the VLG was able to sustainably (or so it seemed) break out above the 510 level. Here was our post and chart at the time.
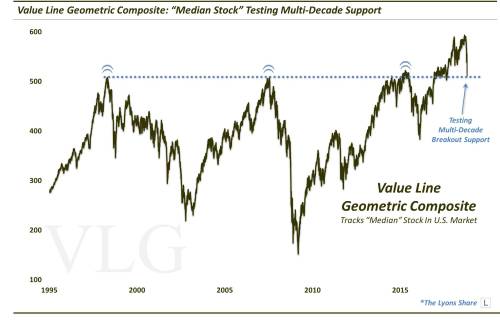
After about 12 months of solid follow-through to up near the 600 level, the VLG pulled back sharply last quarter along with the rest of the market. In the initial selloff, the index did attempt to hold that 510 level, which we termed “the mother of all support levels” in late October.
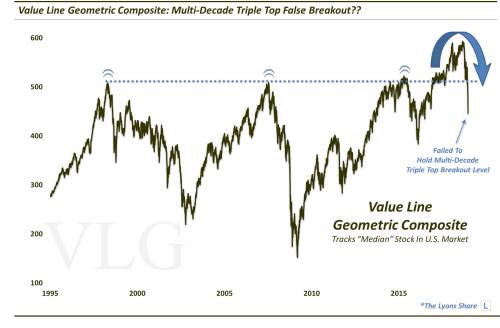
However, after 6 weeks of trying to hold on, the 510 level gave way. Now, instead of the immensely positive multi-decade triple top breakout that we witnessed in 2017, we were left with an equally meaningful negative false breakout – i.e., our 2018 Chart Of The Y(B)ear.
The VLG did manage to find subsequent support at our “Once A Decade” support levels, along with the rest of the market in late December. And after bottoming around 445, the index has soared back some 15% over the past 3 weeks. That bounce has brought the VLG back to – guess what level? Yep, 510, as of yesterday’s close.
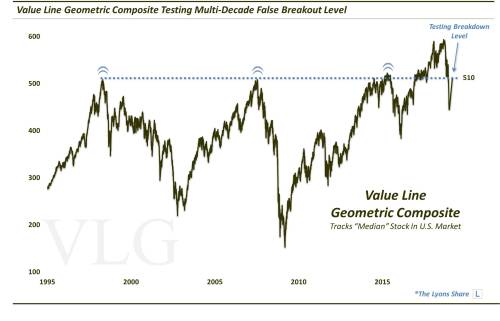
So will this 510 level on the Value Line Geometric Composite continue to display the generational relevance that it has for more than 20 years now? Importantly, this morning’s action has taken the index up to the 516 level – does that mean that the index, and maybe the overall market, is out of the woods now? Or will this move prove fleeting and result in the index quickly losing the 510 level again? In that case, this critical level could well end up repelling this monster bounce in the market, send prices hurtling back down and confirm the multi-decade false breakout.
IF it is the latter, considering the decades of price relevance here, this may be the mother of all short setups.