
- New Year Starts With A Rally
- Sector & Market Analysis
- 401k Plan Manager
New Year Starts With A Rally
Last week, I discussed the potential for a rally as we head into the New Year based on both the more extreme levels of short-term oversold conditions coupled with the statistical tendencies going back to 1990. To wit:
“Interestingly, the market retraced exactly 38.2% of the previous decline and failed at important overhead support…it is critically important the markets muster a rally, otherwise, we are most likely looking at a retest of recent lows at a minimum, or new lows at the worst.
While I still expect a rally which could potentially reach 2650-2700, the overall market environment remains negative which, for longer-term investors, continues to favor higher levels of cash and fixed income.”
Don’t forget to grab a cup of coffee and start your trading/investing day with me as I kick off my new radio show.
Streaming Live On The Web
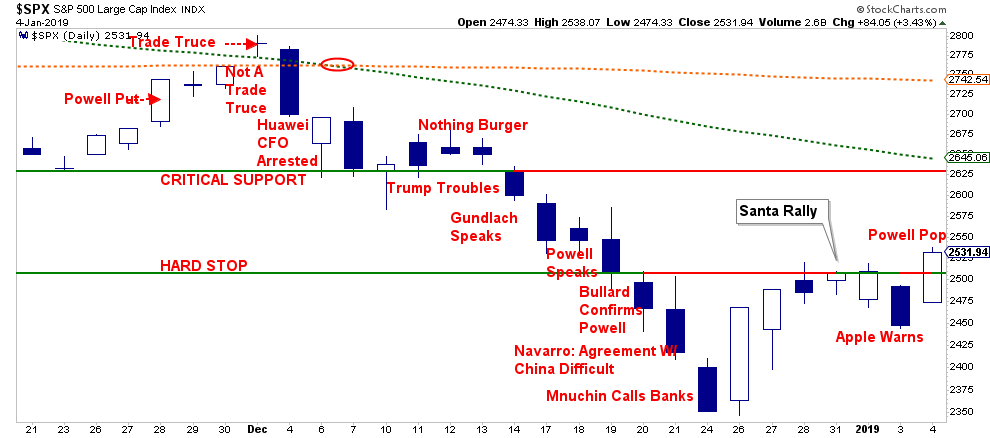
Well, on Monday, Jerome Powell, who was speaking on a panel with Janet Yellen and Ben Bernanke, said the Central-Bank’s policy is flexible and officials are “listening carefully” to the financial markets. Critically, for traders worried about shrinking liquidity in the economy, Powell also signaled a willingness to consider changes to the Fed’s gradual run-off of its balance-sheet in any policy review.
That statement led to a flurry of buying activity which reversed all of Thursday’s rout which was driven by a collapse in the ISM Manufacturing Report and a severe economic warning coming from Apple (AAPL).
While, at this point, the risk/reward for traders remains on the “bullish” side, the economic warnings from Fed Ex (FDX), Apple (AAPL), and the economic surveys should not be dismissed.
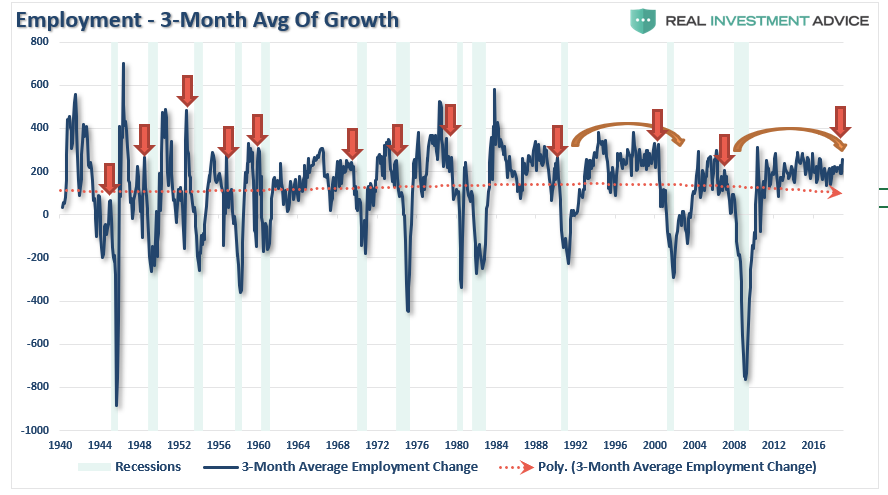
But what about that surging jobs report?
On Friday, the employment report showed an increase of 312,000. While that was indeed a good number, such doesn’t mean much within the context of the overall employment trend. More importantly, employment ALWAYS tends to spike up just before the onset of a recession as employment is a lagging indicator of the overall economic cycle.
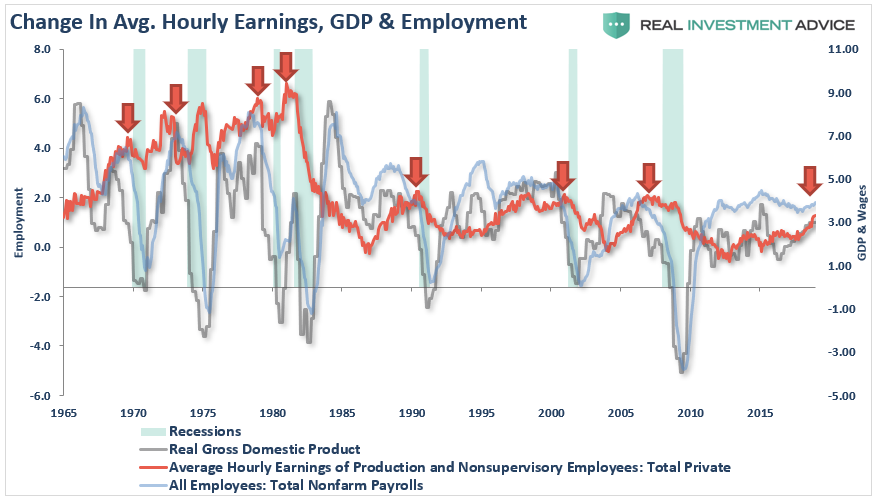
Here is another way to look at it.
While employment ticked up, so did wages which directly impacts corporate profit margins. Not surprisingly, wage increases are a late-economic indicator and precede the onset of recessionary environments.
While Larry Kudlow was quick to jump on “the Twitter” and proclaim “no recession in sight,” I would suggest the recent components of the report likely suggests one in closer than most think.
The importance of this goes back to the market’s latest rally.
While the market is indeed working off a very oversold condition, it is most likely not the resumption of the previous “bull market” yet.
Let’s go to the charts.
Daily
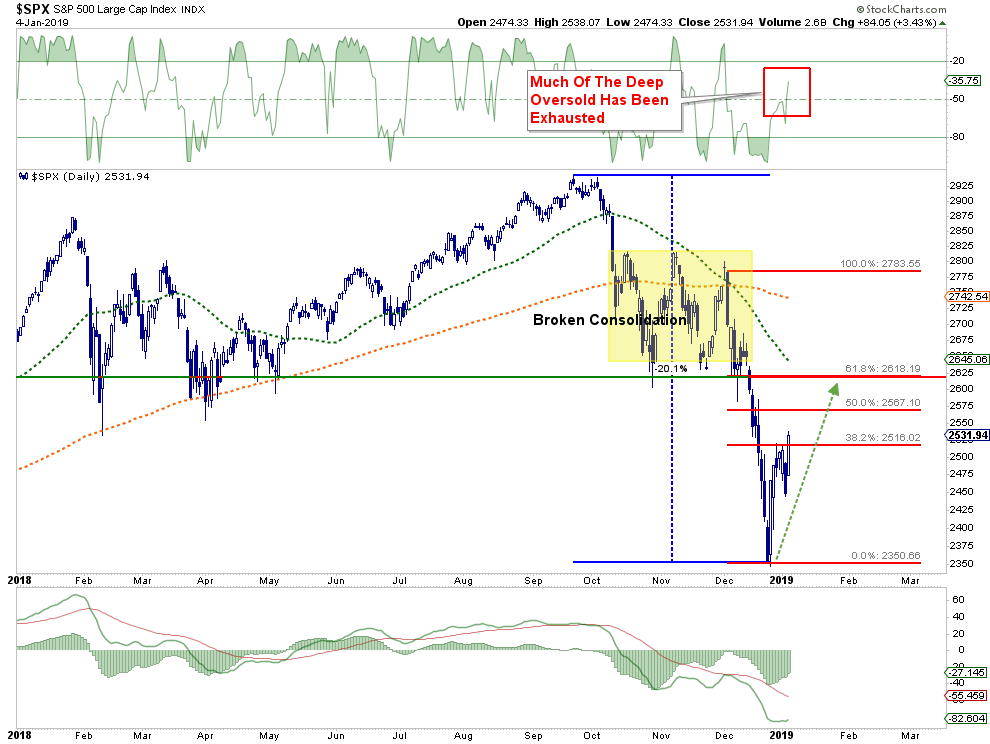
First, the rally on Friday, while very positive, did little to reverse the overall negative trend of the market.
However, from a bullish setup, the market did establish a “higher low” from the Christmas Eve rout. With the break above the previous resistance level, the market is now set up to rally to our next resistance levels.
If we use a Fibonacci retracement from the previous market highs, we can see a potential retracement back to the previous lows from early 2018 which would equate to a 38.2% retracement.
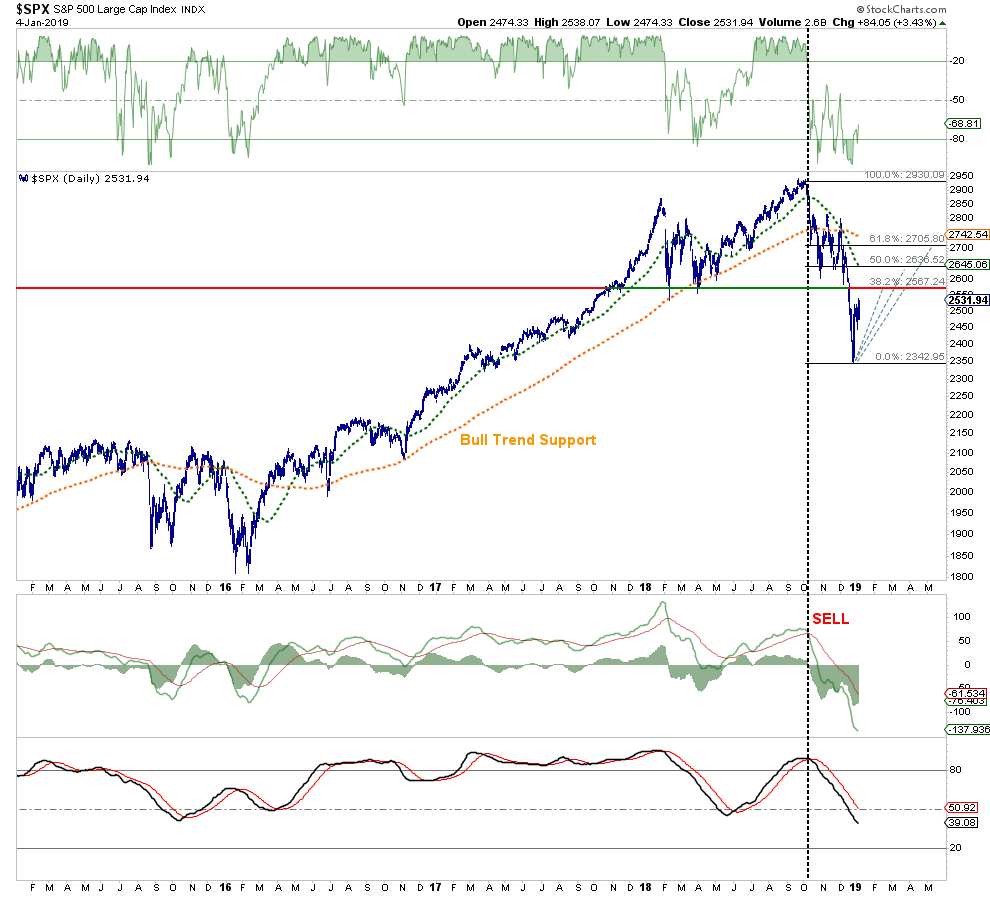
This is the most likely the easiest level for the markets to achieve over the next month or so.
But, if Powell does indeed begin to back off rate hikes, President Trump acquiesces to some deal with China, and corporate outlooks begin to improve somewhat, then a rally back to the 50% or 68.2% retracement levels become much more possible.
Such a rally will continue to be a “sellable rally” as the technical damage done to the markets last year has rendered the weekly and monthly charts much more bearish currently.
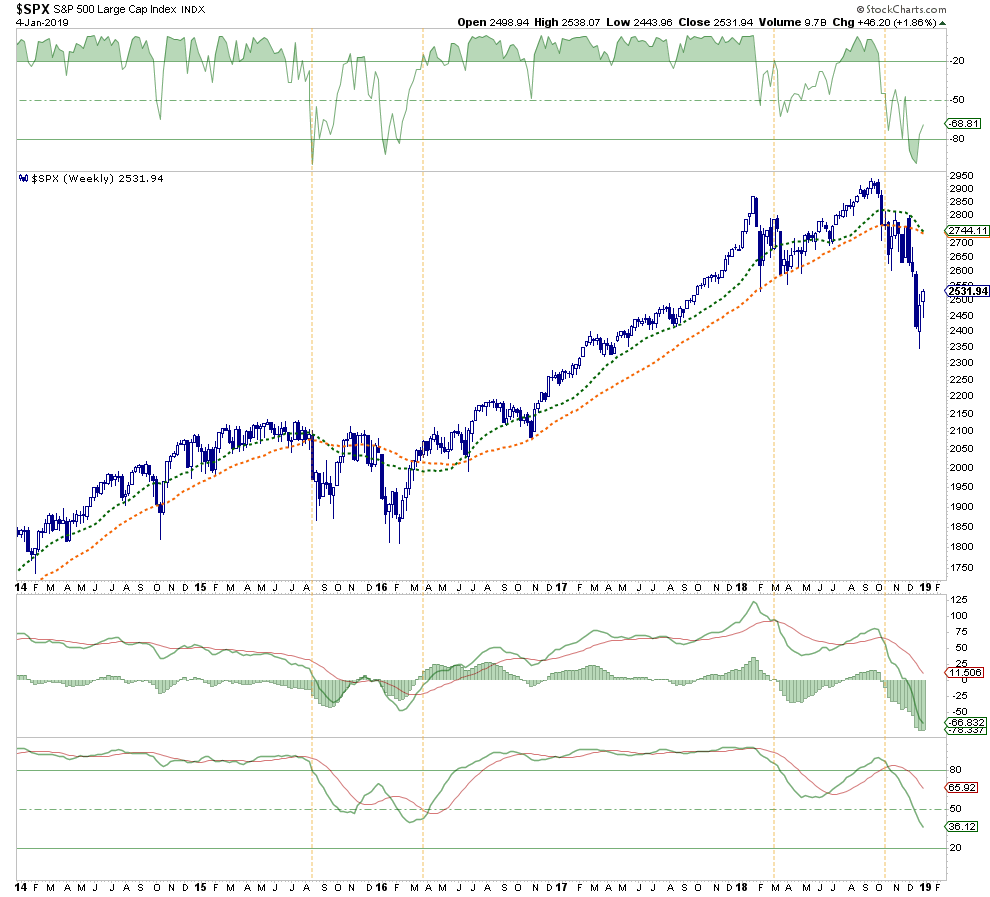
Weekly
For the first time since 2015, which lead to the correction heading into 2016, the markets have registered a weekly “sell” signal. The last time a weekly signal was registered was heading into the 2008 “financial crisis.”
While many market participants are quick to assume the current correction is going to be like 2015-2016, the difference this time is that the Federal Reserve is extracting liquidity from the markets and interest rates are substantially higher.
In fact, the last time the Fed was hiking rates, the economy had begun to show signs of slowing, and corporate profits and stock buybacks had peaked – was in late 2007.
Just sayin’
Monthly
More importantly, the warning from the recent market rout is much more prevalent on a monthly, long-term, chart. With long-term bullish trends broken, long-term moving averages negative crossing, and sell-signals registered across the board, it is time for long-term investors to be much more cautious.
This is particularly the case given that our long-term monthly “SELL” signal has been registered for only the 5th time since the turn of the century.
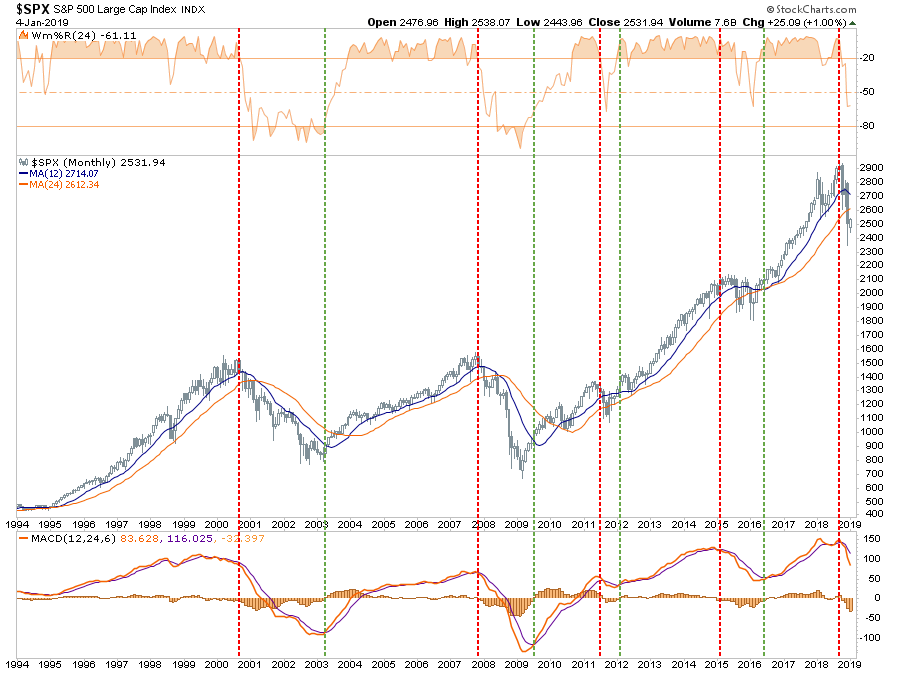
Unfortunately, given that we have now triggered a monthly sell signal for only the 4th time in 20-years the longer-term outlook remains with the bears. As you will notice in both of the previous “bear” markets, oversold conditions remained oversold for quite some time.
Conclusion
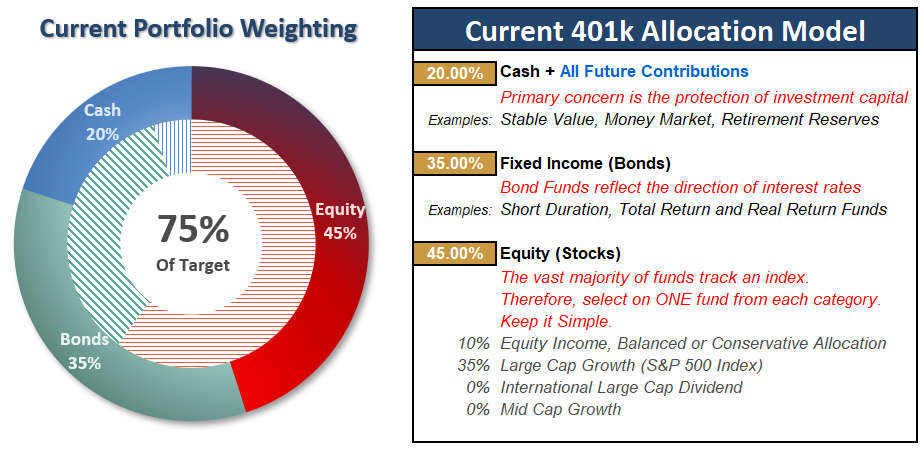
Are becoming much more cautious at the beginning of 2018, we remain overweight cash and fixed income.
However, we also remain long many of our core holdings and in November and late December added positions in companies which had been discounted due to the market’s downdraft.
Our positions in ABBV, MSFT, PFE, MDT, VZ, V, DUK, PEP, AEP, AXP, and others have performed better than the market over the last couple of months and we will look to add to these positions opportunistically if the market continues to improve.
Our bond positions, which we recommended adding to every time rates popped above 3% we stellar winners last year and protected the overall portfolio from a more substantial decline.
However, not everything went according to plan with FDX and CDW performing poorly. These positions are set to be sold on this rally with the funds being allocated to other opportunities.
The risk to the market remains high, but that doesn’t mean we can’t make money along the way.
We are excited about the opportunity to finally be able to add a “short book” to our portfolios for the first time since 2008. It is too early in the market transition process to implement such a strategy, but the opportunity is clearly forming.
See you next week.
THE REAL 401k PLAN MANAGER
A Conservative Strategy For Long-Term Investors
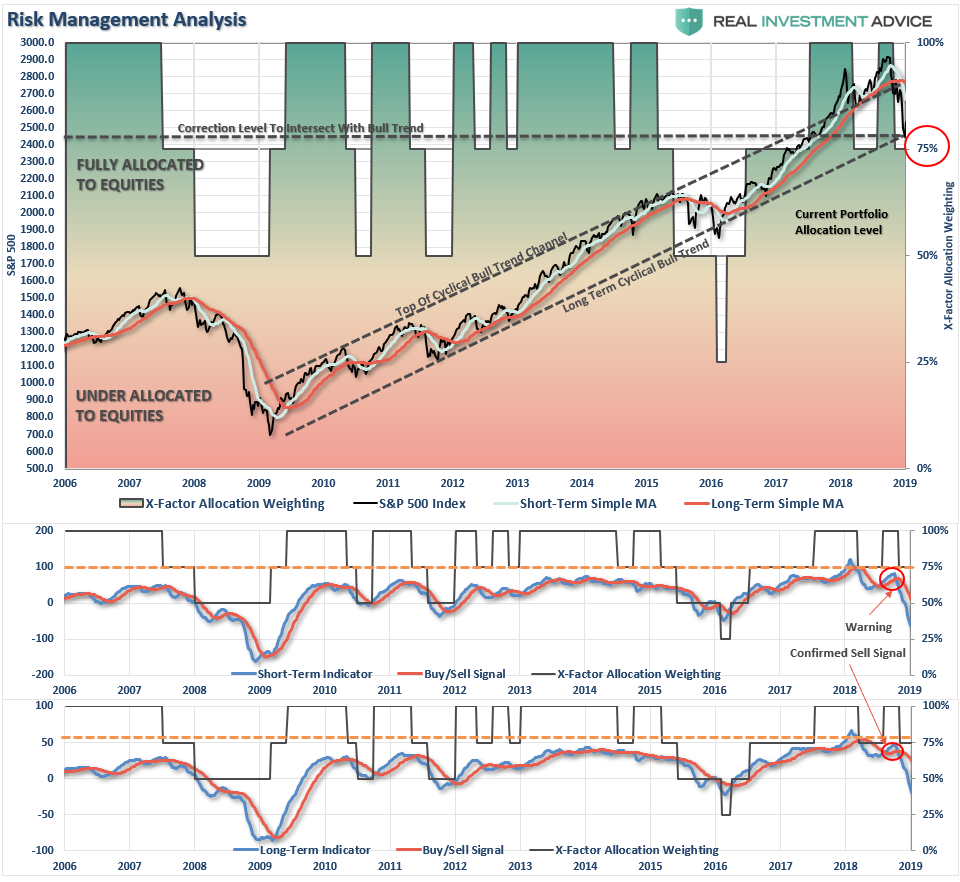
There are 4-steps to allocation changes based on 25% reduction increments. As noted in the chart above a 100% allocation level is equal to 60% stocks. I never advocate being 100% out of the market as it is far too difficult to reverse course when the market changes from a negative to a positive trend. Emotions keep us from taking the correct action.

Finally, A Rally
Since I was trapped in a “snow storm” last week, literally, let’s review where we left off two weeks ago.
“The overall market environment remains difficult and dangerous…it is critically important for the “bulls” to try and rally the market next week.
With the portfolio managers needing to reposition next week for the end of year reporting, a rally, which so far has proved elusive, is once again likely as reward outweighs risk.
Well, we finally got the rally we were looking for which could possibly extend into next week. However, as I have stated previously, with sell signals triggered on both a weekly and monthly basis, these “clearing rallies” should be used to reduce equity risk to the markets.
In the coming weeks, any rally that takes the markets back to short-term over “bought” conditions will be used to lower equity exposure to 50%, or a target or 30% equity in our 60/40 model.
Continue to use rallies to reduce risk towards a target level with which you are comfortable. Remember, this model is not ABSOLUTE – it is just a guide to follow.
- If you are overweight equities – reduce international, emerging market, mid, and small-capitalization funds on any rally next week. Reduce overall portfolio weights to 75% of your selected allocation target.
- If you are underweight equities – reduce international, emerging market, mid, and small-capitalization funds on any rally next week but hold everything else for now.
- If you are at target equity allocations hold for now.
Unfortunately, 401k plans don’t offer a lot of flexibility and have trading restrictions in many cases. Therefore, we have to minimize our movement and try and make sure we are catching major turning points. Over the next couple of weeks, we will know for certain as to whether more changes need to be done to allocations as we head into the end of the year.
If you need help after reading the alert; don’t hesitate to contact me.
Current 401-k Allocation Model
The 401k plan allocation plan below follows the K.I.S.S. principle. By keeping the allocation extremely simplified it allows for better control of the allocation and a closer tracking to the benchmark objective over time. (If you want to make it more complicated you can, however, statistics show that simply adding more funds does not increase performance to any great degree.)
401k Choice Matching List
The list below shows sample 401k plan funds for each major category. In reality, the majority of funds all track their indices fairly closely. Therefore, if you don’t see your exact fund listed, look for a fund that is similar in nature.
