Authored by Lance Roberts via RealInvestmentAdvice.com,
Market Takes A Tumble
Last week, I discussed the continuation of the “market melt-up.” To wit:
“Since the beginning of the year, the acceleration in the markets has continued unabated. As I showed yesterday, the acceleration in the S&P 500 has now gone parabolic.”
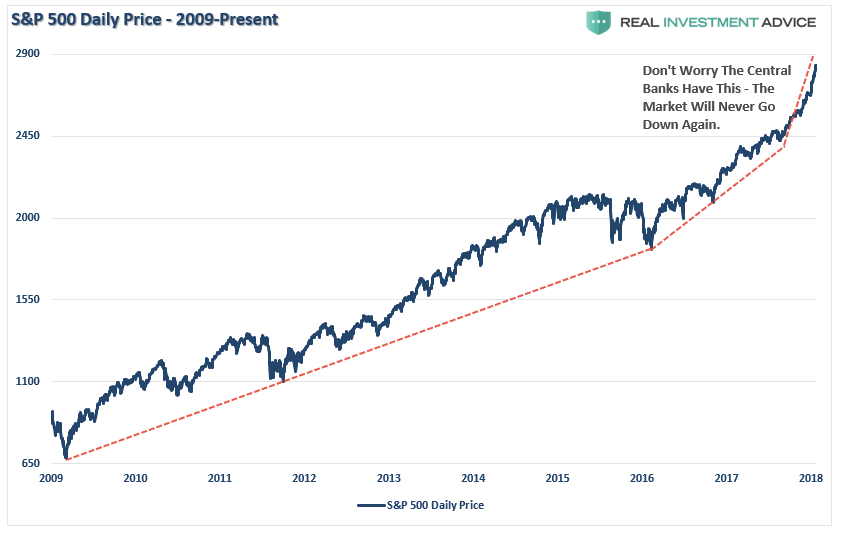
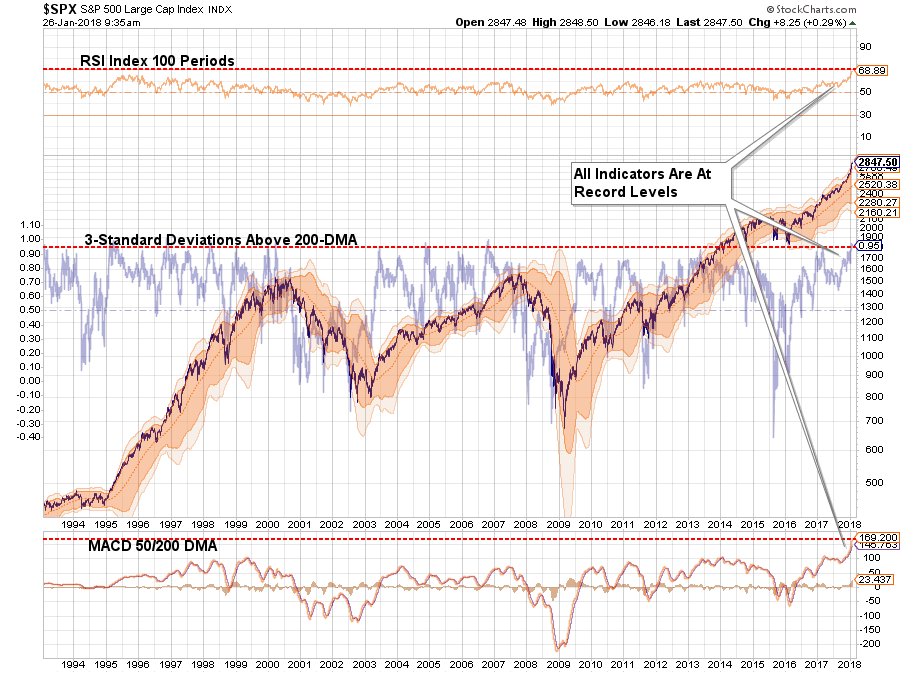
“Never before in recent history has the market been this overbought and extended from longer-term averages which suggests that a correction that reduces such conditions is highly likely in the near-term.”
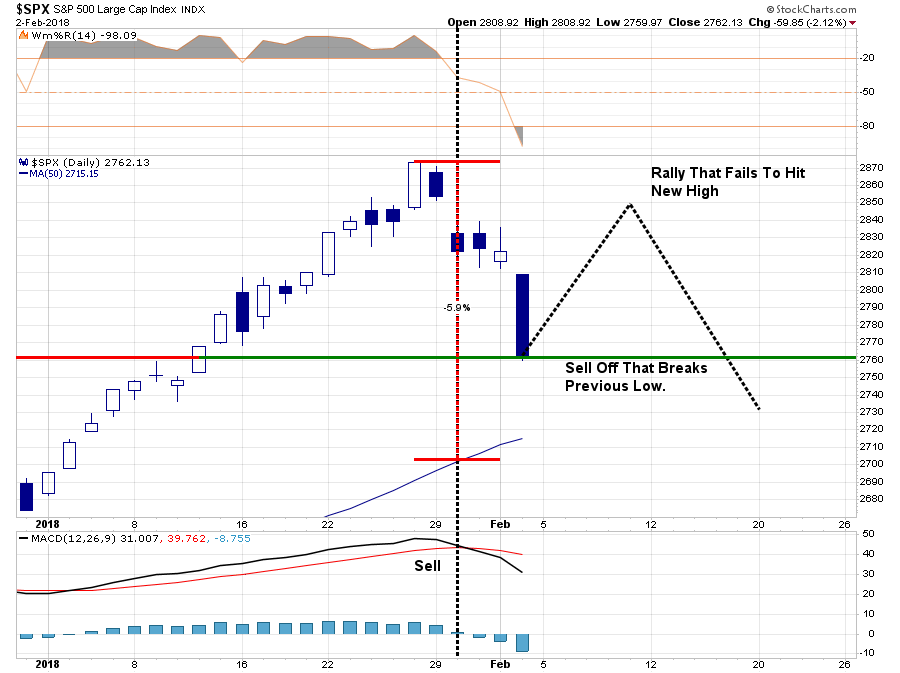
Well, this past week, the market tripped “over its own feet” after prices had created a massive extension above the 50-dma as shown below. As I have previously warned, since that extension was so large, a correction just back to the moving average at this point will require nearly a -6% decline.
I have also repeatedly written over the last year:
“The problem is that it has been so long since investors have even seen a 2-3% correction, a correction of 5%, or more, will ‘feel’ much worse than it actually is which will lead to ’emotionally driven’ mistakes.”
The question now, of course, is do you “buy the dip” or “run for the hills?”
Don’t do either one, yet.
Yes, corrections do not “feel” good. But they are part of a “healthy” market cycle. In more normal, healthy, bullish trends corrections should be used as buying opportunities to increase exposure to equity risk in portfolios.
However, the recent parabolic acceleration in the markets heading into the New Year was neither normal or healthy. Much of it had to do with the massive liquidity injection by the Federal Reserve at the end of 2017 as shown below.

But, after the stumble this past week, it will be interesting to watch the next the Fed’s balance sheet over the next month to see if they continue with their planned $30 billion / month reduction.
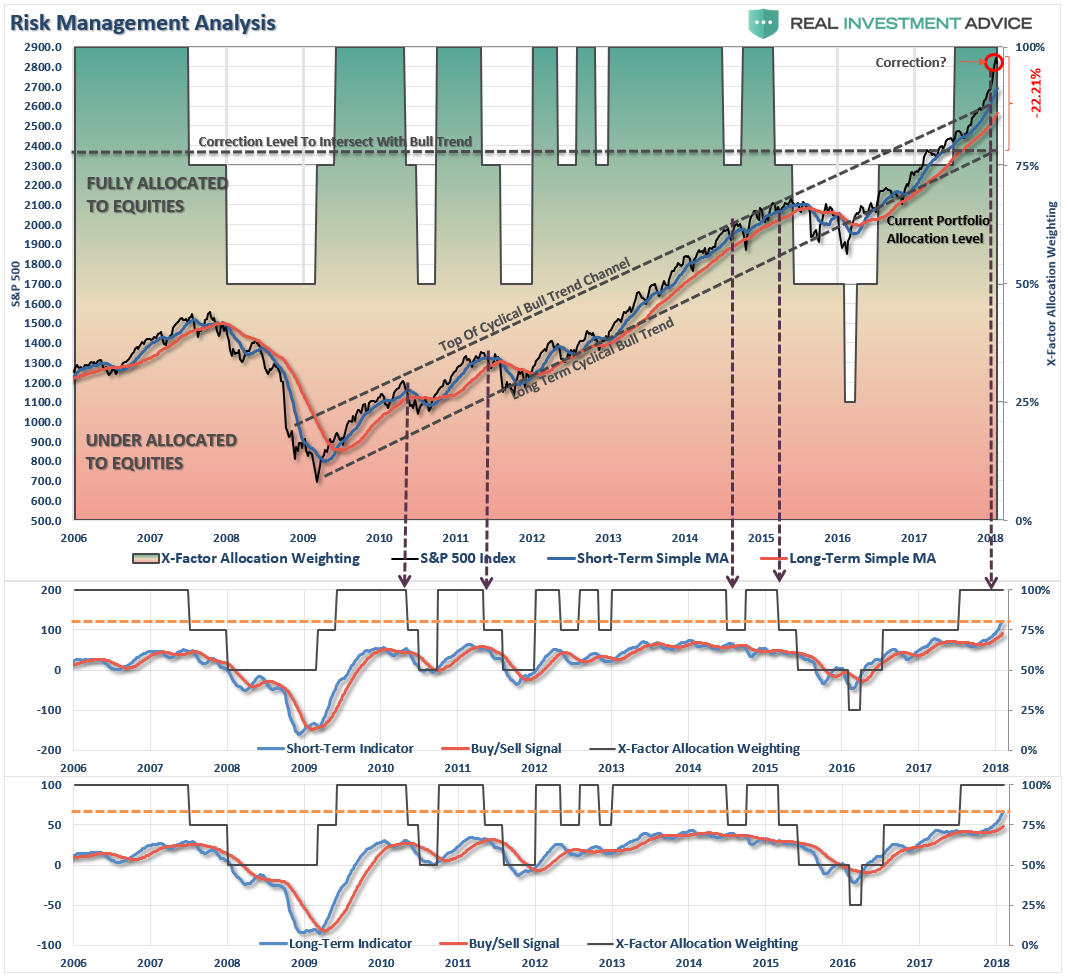
At the moment, this is the expected correction we have been discussing over the last several weeks. It is also something we had planned for by reducing overweight positions and adding a short-hedge to portfolios.
With the markets on a short-term sell signal (noted by gold vertical dashed lines in the chart above,) the current correctional process is underway and still has room to go at this juncture. But, with the market now oversold on a VERY short-term basis a rally over the next week, or so, would not be surprising.
It is the outcome of that rally that is most important to the current bull market advance.
This is what we are looking for to drive our next set of portfolio actions:
- If the market rallies back and sets a new closing high, the bullish trend will be confirmed and equity allocations will remain at target levels and hedges removed.
- If the market rallies back BUT FAILS to set a new high, a series of actions will take place.
- At the point of rally failure, portfolio hedges will be modestly increased.
- If the subsequent decline breaks the previous low, the hedges will be further increased and tactical trading long positions will be reduced.
Why is this important?
A Hint Of 1987
A recent article on Zerohedge discussing a view of Albert Edwards is salient to this discussion.
“Certainly, as we explained at our Conference, the current conjuncture feels similar to just before the 1987 equity crash. All that was missing was the slanging match over the weak dollar between the US and Europe.”
He’s right. There are many similarities between today and 1987. Recently passed tax legislation reform, exuberance in the markets, and a strong market rally.
And then the crash.
But no one could have seen that coming? Right?
(We have an in-depth report, titled 1987, coming out next week ONLY for our newsletter subscribers and those who have expressed an interest in our soon to be released RIA Pro.
If you are not currently on our email list and want a copy of the report click here.)
Actually, there were five technical signals, that when considered along with fundamental factors should have been enough to warrant caution at a minimum…that is if you were paying attention.
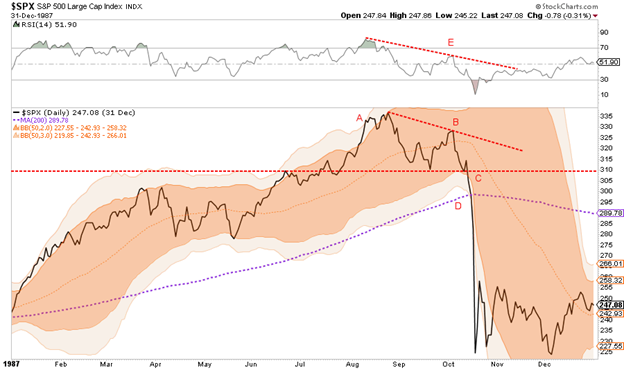
The graph above, from our 1987 article, highlights the technical indicators which are explained in the report along with a summary of the myriad of fundamental factors that preceded Black Monday. There are certainly many differences between today and 1987, but as we highlight in the report there are many similarities as well worth considering.
Along with plummeting stock prices in October of 1987, interest rates also declined sharply as money sought the relative safety of bonds.
It is here that I also agree with Albert Edwards:
“Every man, woman, and child seems to have decided that the US 10y bond yield has broken out of its long-term downtrend and we are in a bond bear market. Our own excellent Technical Analyst, Stephanie Aymes, shows that 3% (not 2.6%) is the key long-term breakout yield we should be watching. But she thinks that 2.64% was also significant as this means the RSI downtrend has now been broken and a run to 3% is now perfectly plausible. That though does not mean the bond bull market is over.”
With yields now closing on 2¾% and the 30y closing on 3.0%, many see this as a great time to dump bonds and switch into equities. Really?
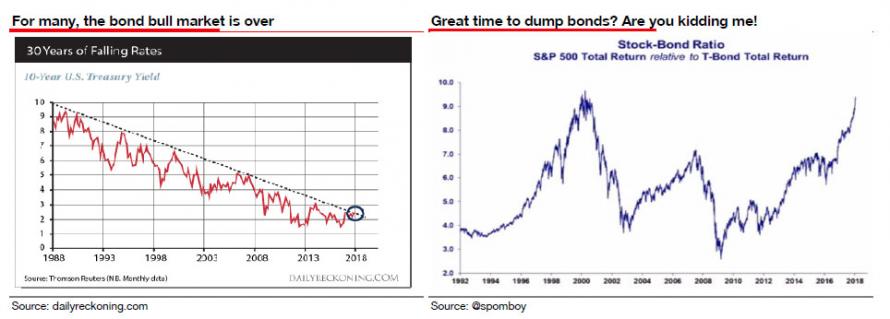
“Well, I expect that the true extent of how close the US is to actual outright deflation, and hence how high real yields currently are, will soon be revealed. But before US 10y yields turn negative, expect them to visit 3% first.“
He is absolutely right. Despite a rampant rise in the markets, the recent spate of economic growth has been due to massive natural disasters across the lower third of the U.S. The impetus from those rebuilding efforts are now running their course and we are already seeing a weakness in the numbers.
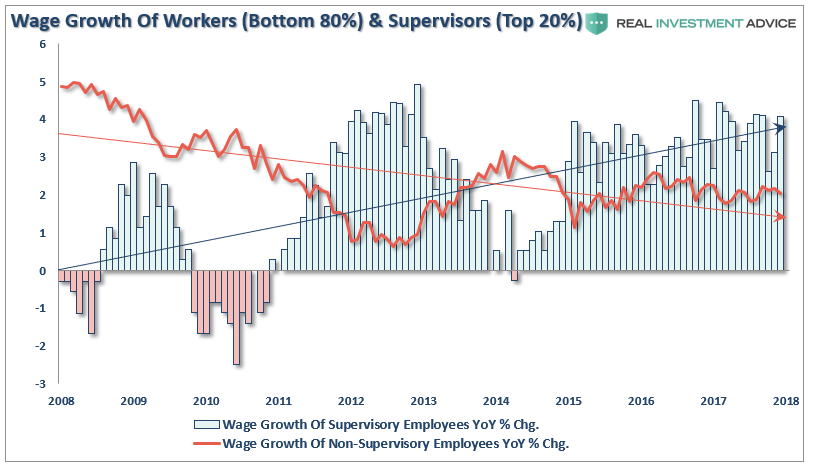
But wages are crushing it, and employment is booming?
Yes, wages are rising but only for the top 20% of workers.
And employment in the key demographic is not.

The Next Bull Market
Edwards is correct. There are several important points to understand about bonds.
- All interest rates are relative. With more than $10-Trillion in debt globally sporting negative interest rates, the assumption that rates in the U.S. are about to spike higher is likely wrong. Higher yields in U.S. debt attracts flows of capital from countries with negative yields which push rates lower in the U.S. Given the current push by Central Banks globally to suppress interest rates to keep nascent economic growth going, an eventual zero-yield on U.S. debt is not unrealistic.
- The coming budget deficit balloon. Given the lack of fiscal policy controls in Washington, and promises of continued largesse in the future, the budget deficit is set to swell back to $1 Trillion or more in the coming years. This will require more government bond issuance to fund future expenditures which will be magnified during the next recessionary spat as tax revenue falls.
- Central Banks will continue to be a buyer of bonds to maintain the current status quo, but will become more aggressive buyers during the next recession. The next QE program by the Fed to offset the next economic recession will likely be $2-4 Trillion which will push the 10-year yield towards zero.
The next bull market is coming, it just won’t be in stocks.
It will be in the U.S. Treasury market which will coincide with the next recessionary drag in the economy within the next 12-18 months (at the most).
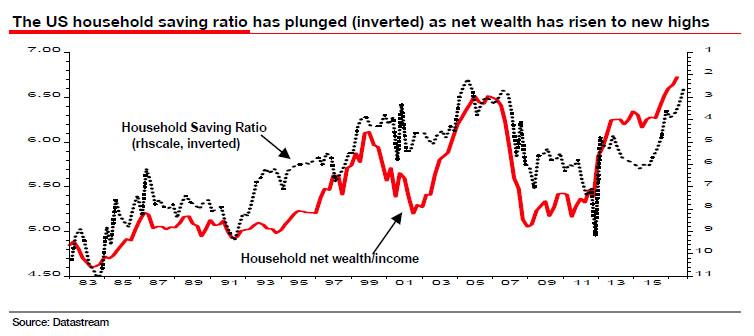
As I have written previously, interest rates have everything to do with economic growth. Since economic growth is almost 70% driven by consumption, with savings rates extraordinarily low and debt hitting record levels, small increases to interest rates will have an immediate negative impact on the consumptive capability of U.S. citizens.
The chart below goes to my point. Currently, interest rates are 4-standard deviations above their 1-year moving average. (For an explanation read this.)
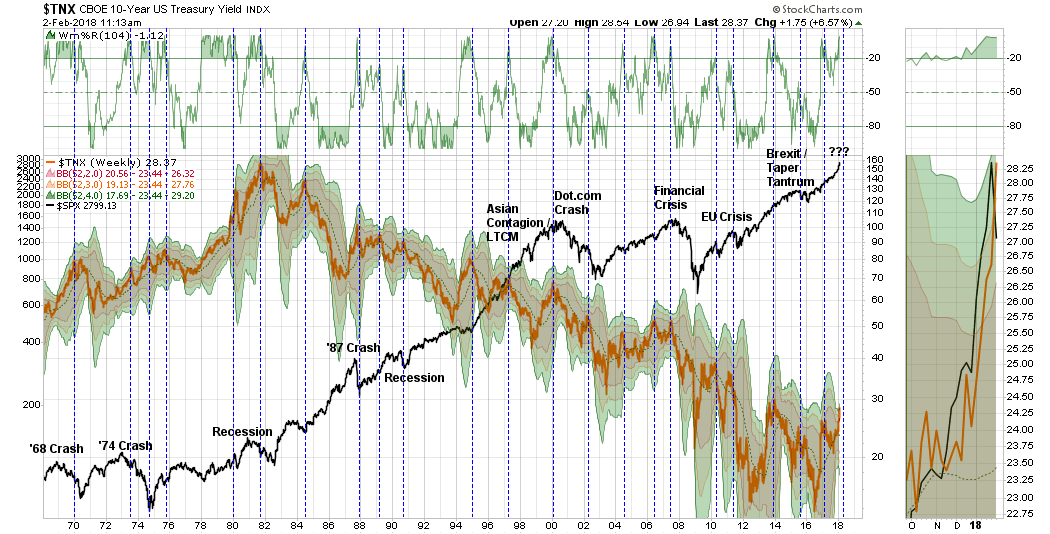
How often has this happened going back to 1965?
Never.
Negative events such as the S&L Crisis, Asian Contagion, Long-Term Capital Management, etc. all drove money out of stocks and into bonds pushing rates lower, recessionary environments are especially prone at suppressing rates further. Given the current low level of interest rates, the next recessionary bout in the economy will very likely see rates near zero.
Furthermore, given rates are already negative in many parts of the world, which will likely be even more negative during a global recessionary environment, zero yields will still remain more attractive to foreign investors. This will be from both a potential capital appreciation perspective (expectations of negative rates in the U.S.) and the perceived safety and liquidity of the U.S. Treasury market.
However, what you will notice is that each time rates were as overbought as they are currently, they coincided with either a recession, a correction, or a major market crash.
Could this time be different? Sure. It’s possible.
But probably, it won’t be. The stock market is a reflection of the economy, not the other way around. Higher interest rates are a drag on economic growth which will impact earnings and valuations for the market.
Not tomorrow. Or even next week.
But over the next several months, higher interest rates, if they remain elevated for long, will have a deleterious effect on the economy.
Valuations will become problematic.
Furthermore, the safety of bonds becomes much more attractive when the yield is significantly above the dividend yield in stocks. (Why take the risk is stocks for a sub-2% yield when I can get 3% in a U.S. Treasury?)
That’s not hard math.
Things are finally starting to get interesting.
See you next week.
Market & Sector Analysis
Data Analysis Of The Market & Sectors For Traders
S&P 500 Tear Sheet
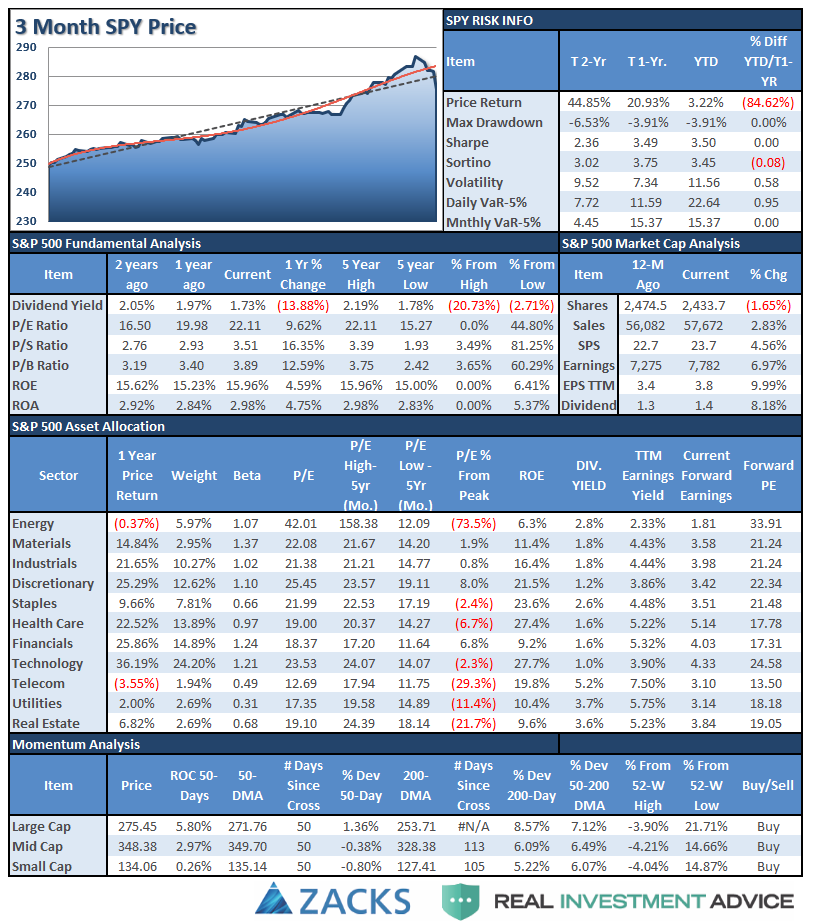
Performance Analysis
We are updating this analysis, it will return next week.
ETF Model Relative Performance Analysis
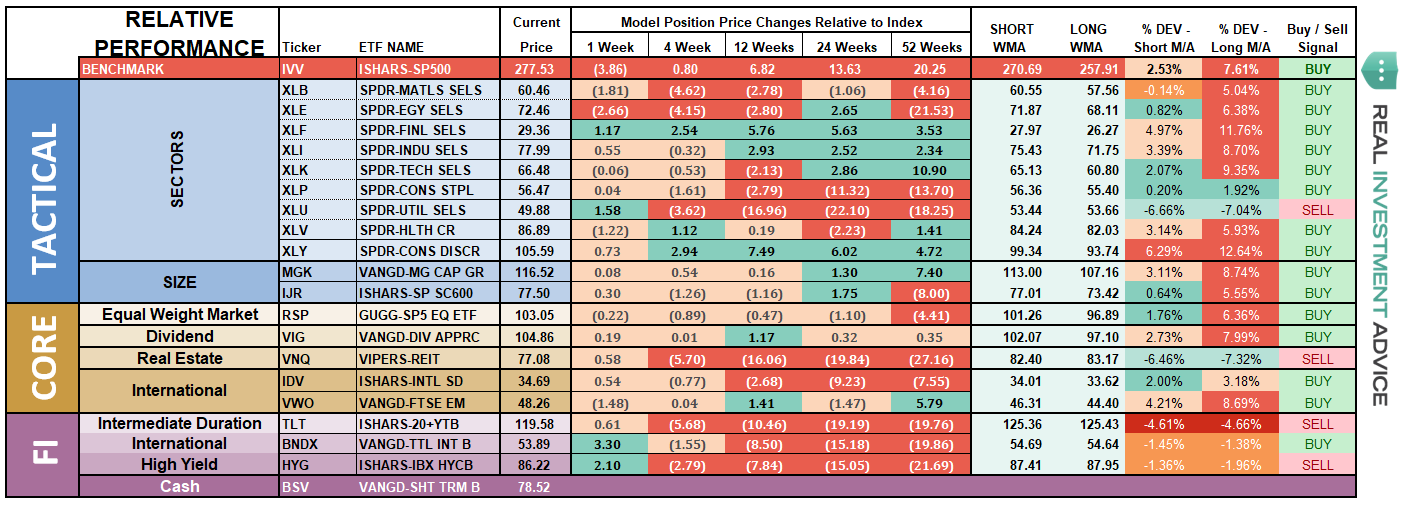
Sector & Market Analysis:
Well, that escalated quickly.
Last week I wrote:
“This is just getting a bit TOO extreme. Take a look at the sectors below. Every sector is pushing 2- and 3-standard deviations of longer-term moving averages.
This isn’t normal.”
The reversal came this past week.
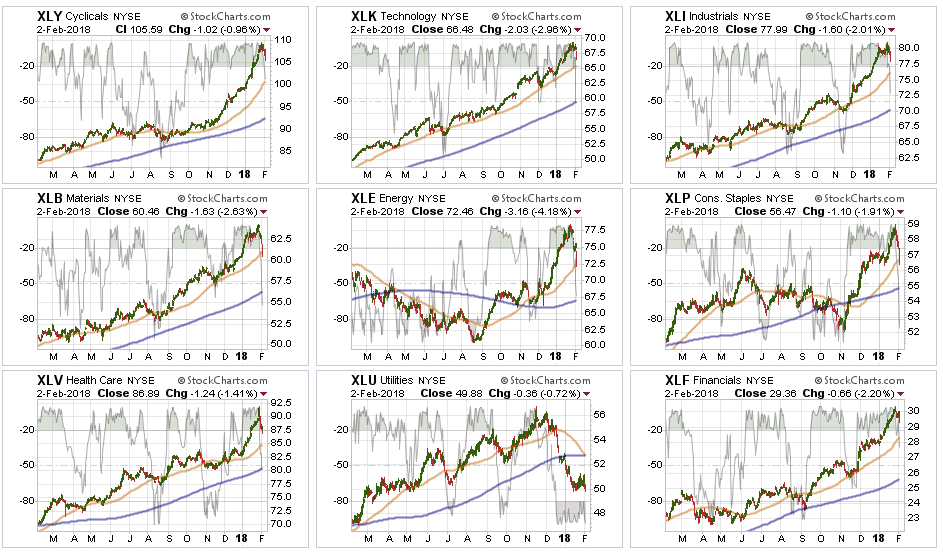
Every Sector was in sell-off mode last week, in particular on Friday, as money left the markets entirely. Basic Materials, Energy, and Staples all broke their 50-dma, while Healthcare, Financials, Discretionary, Technology, and Industrials are still heading towards it.
While it is VERY likely we will get a counter-trend bounce next week, there is still likely more selling to come as we head into February. The question is whether current bullish trends will hold, or not? I suspect they will, for now, which will keep portfolios primarily allocated to the long-side. However, we will monitor and adjust holdings accordingly.
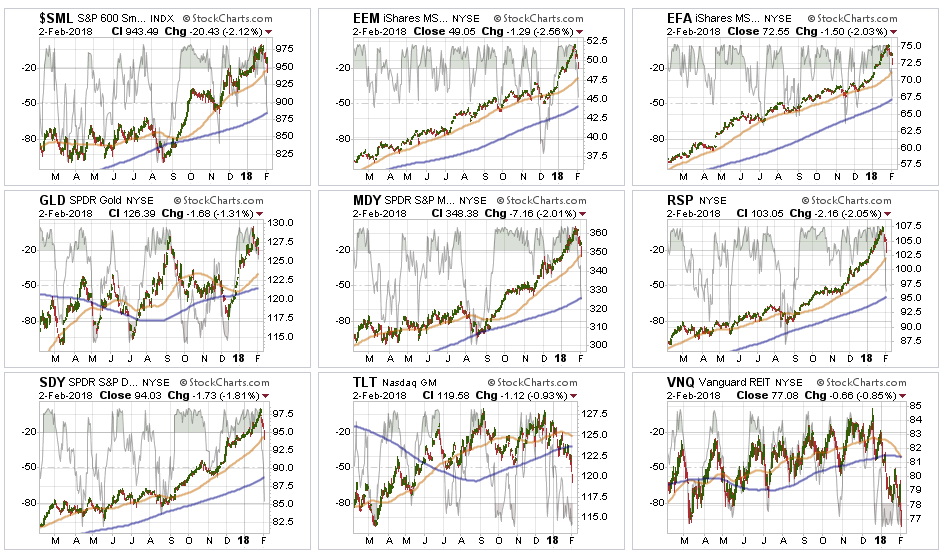
Small and Mid-Cap index We hare repeatedly suggesting taking profits and rebalancing to portfolio weights in recent months. The sell-off last week explains why. While markets all remain positively trending currently, risk is rising that something more may be on the horizon. Use any bounce next week to rebalance holdings and raise stops if you have not already.
Emerging Markets and International Stocks As noted above, rebalancing portfolio weights and reducing some risk is prudent here as well. Trends remain positive, but there is risk of a bigger correction on the horizon so a bit of risk management remains prudent.
S&P Equal Weight & Dividend Stocks – Dividend stocks are flirting with support, but are now back to oversold conditions. After a hefty rise, we will look to trim back positions on a rally in the next week.
Bonds and REIT’s – We remain long these sectors currently, but they are both testing our long-term stop loss levels. With rates GROSSLY extended, as noted in the main missive above, we will look for a rally to re-evaluate our holdings. We still expect interest rate sensitive holdings to be important during a “risk off” rotation, although that wasn’t the case this past week. Our conviction on these positions continues, but we are still honoring our longer-term stop-loss levels and will exit accordingly if needed.
Sector Recommendations:
(These are not recommendations or solicitations to take any action. This is for informational purposes only related to market extremes and contrarian positioning within portfolios. Use at your own risk and peril.)
I am republishing last week’s table to as we had recommended reducing positions across the board due to the sharp ramp in asset prices.
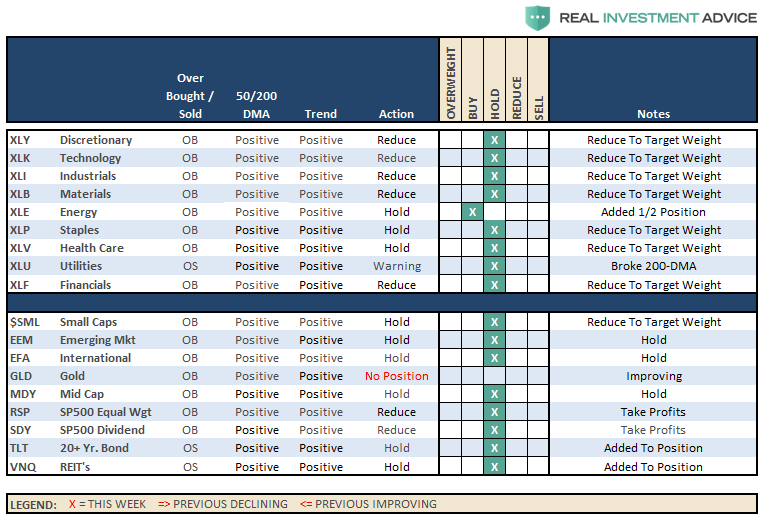
Currently, HOLD, all positions until we get a better understanding of the current correction as noted above. I will update strategy and actions on Tuesday.
Portfolio Update:
Over the last several weeks, we have repeatedly noted the near parabolic rise in the markets and the addition of hedges being added to our portfolios. As noted in the main body of this weekly missive, we shouldn’t make rapid, emotionally based, decisions based on an initial correction.
It is what the market does “next” which will determine our next course of actions.
As far as portfolios go, we continue to maintain our current positions.
- We have taken profits in some of our positions that were most grossly extended.
- We added a short S&P 500 position which is currently working.
- Interest rates, in the very short-term, are not cooperating with our interest rates sensitive exposure and we are monitoring those positions very closely for our next actions.
Currently, everything remains within our longer-term tolerance bands for risk controls. While corrections certainly do not “feel” good, it is important we don’t let short-term pickups in volatility derail longer-term investment strategies.
While positions are certainly under-pressure currently, we are monitoring them closely. We do not recommend making wholesale changes to investments based on a minor market correction which remains well confined to a long-term bullish trend. We are highly concerned about the underlying risk and remain focused on capital controls.
THE REAL 401k PLAN MANAGER
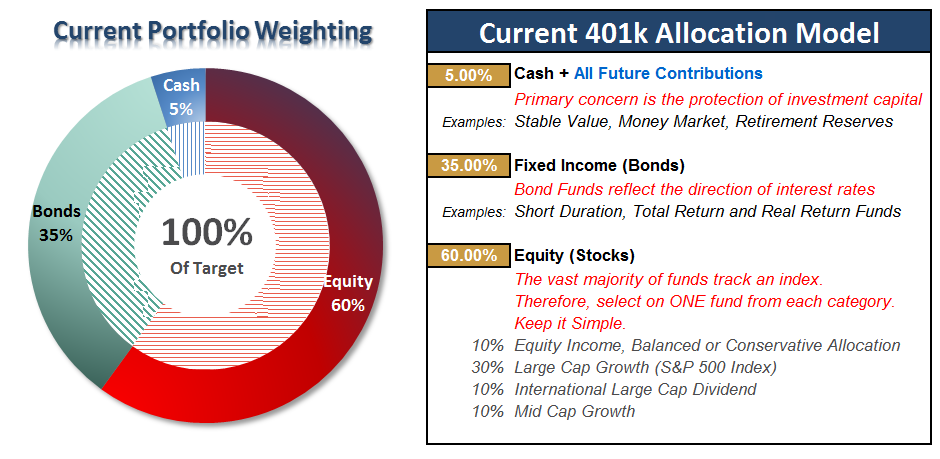
The Real 401k Plan Manager – A Conservative Strategy For Long-Term Investors
There are 4-steps to allocation changes based on 25% reduction increments. As noted in the chart above a 100% allocation level is equal to 60% stocks. I never advocate being 100% out of the market as it is far too difficult to reverse course when the market changes from a negative to a positive trend. Emotions keep us from taking the correct action.

Don’t Panic….Yet.
“Over the last several weeks, I have noted how the current advance just keeps getting “nuttier.” The acceleration of the advance is not only unsustainable, it is also dangerous, as eventually it will lead to a very sharp reversion that few investors are ready for.
But, I know. It hasn’t happened yet.
However, just because it hasn’t happened yet, does not mean it won’t. As with everything in life, ‘timing’ is everything.”
Well, it happened.
And yes, it certainly did not “feel” good.
But as noted repeatedly throughout this weekend’s missive, it is important NOT to mistake a short-term correction for a full-blown reversion. I have circled the “crash” in RED in the chart above…if you can see it.
Keeping perspective is always important.
While this COULD be the beginning of a larger corrective process that will require further action, it is simply WAY to early to know for sure. As I laid out in the main body above, the actions of the market over the next week, or two, will determine our next major course of action.
Continue adding All NEW contributions to cash or cash equivalents like a stable value fund, short-duration bond fund or retirement reserves. We will use these funds opportunistically to add to weightings when the market decides where it is headed next.
If you need help after reading the alert; don’t hesitate to contact me.
Current 401-k Allocation Model
The 401k plan allocation plan below follows the K.I.S.S. principle. By keeping the allocation extremely simplified it allows for better control of the allocation and a closer tracking to the benchmark objective over time. (If you want to make it more complicated you can, however, statistics show that simply adding more funds does not increase performance to any great degree.)
401k Choice Matching List
The list below shows sample 401k plan funds for each major category. In reality, the majority of funds all track their indices fairly closely. Therefore, if you don’t see your exact fund listed, look for a fund that is similar in nature.

Lance Roberts

Lance Roberts is a Chief Portfolio Strategist/Economist for Clarity Financial. He is also the host of “The Lance Roberts Show” and Chief Editor of the “Real Investment Advice” website and author of “Real Investment Daily” blog and “Real Investment Report“. Follow Lance on Facebook, Twitter and Linked-In