In this past weekend’s newsletter, I discussed the potential for an end to the current bull market cycle. It was not surprising that even before the “digital ink was dry,” I received emails and comments questioning the premise.
It is certainly not surprising that after one of the longest cyclical bull markets in history that individuals are ebullient about the long-term prospects of investing. The ongoing interventions by global Central Banks have led to T.T.I.D. (This Time Is Different) and T.I.N.A. (There Is No Alternative) which has become a pervasive, and “Pavlovian,”investor mindset. But therein lies the real story.
The chart below shows every economic expansion going back to 1871 and the subsequent market decline.
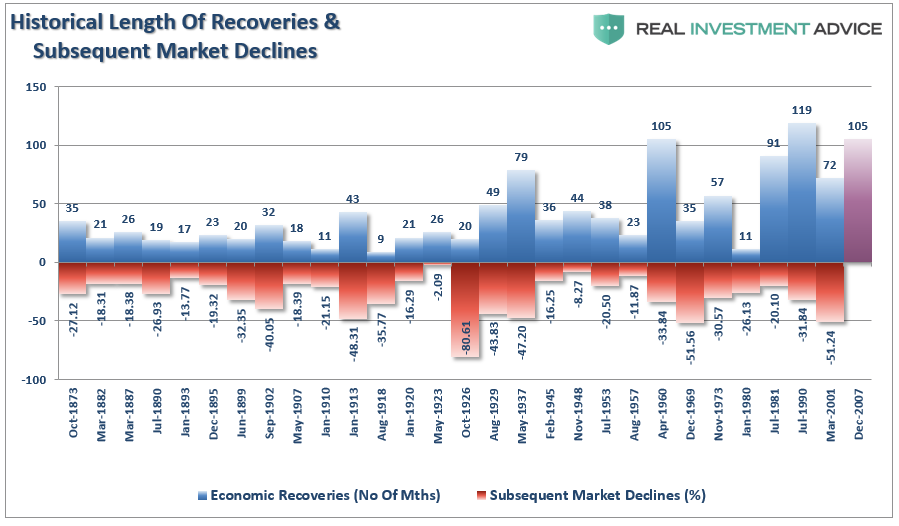
This chart should make one point very clear – this cycle will end.
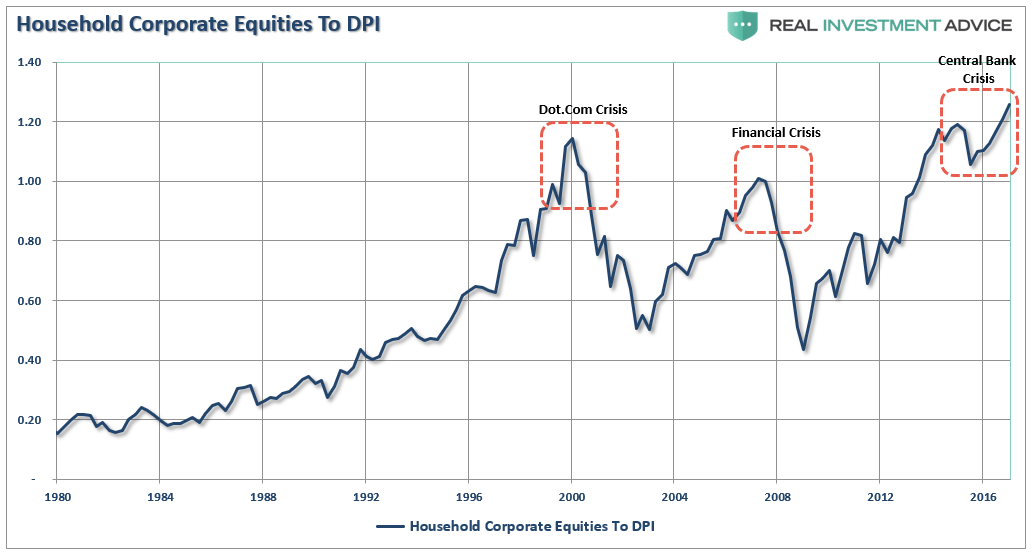
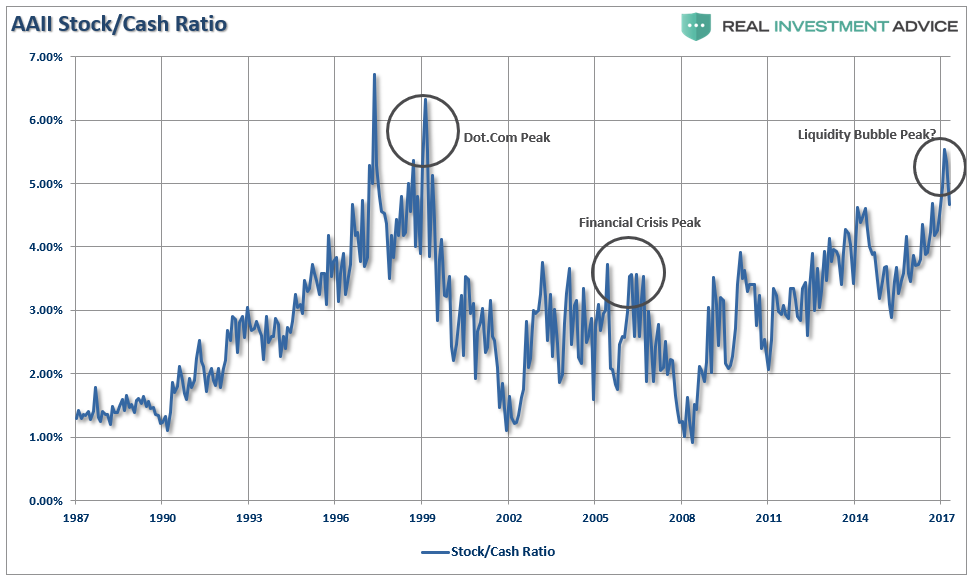
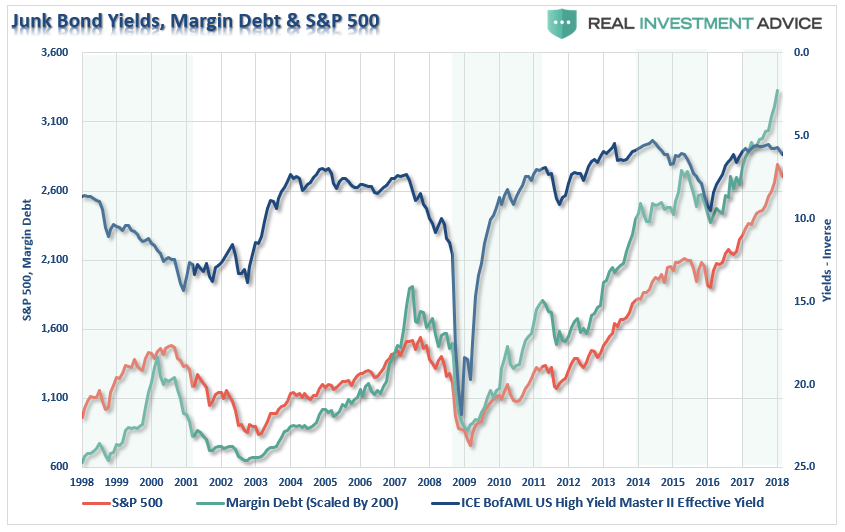
However, for now, there is little doubt the bullish bias exists as individuals continue to hold historically high levels of equity and leverage, chasing yield in the riskiest of areas, and maintaining relatively low levels of cash as shown in the charts below.
There are only a few people, besides me, that discuss the probabilities of lower returns over the next decade. But let’s do some basic math.
First, the general consensus is that stocks will return:
- 6%-8%/year in real (inflation-adjusted) terms,
- plus or minus whatever changes we see in valuation ratios.
Plug in the math and we get the following scenarios:
- If P/E10 declines from 30X to 19X over the next decade, equity returns should be roughly 3%/year real or 5%/year nominal.
- If P/E10 declines to 15X, returns fall to 1%/year real or 3%/year nominal.
- If P/E10 remains at current levels, returns should be 6%/year real or 8%/year nominal.
Here is the problem with the math.
First, this assumes that stocks will compound at some rate, every year, going forward. This is a common mistake that is made in return analysis. Equities do not compound at a stagnant rate of growth but rather experience a rather high degree of volatility over time.
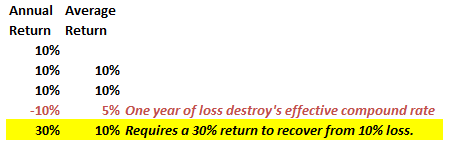
The ‘power of compounding’ ONLY WORKS when you do not lose money. As shown, after three straight years of 10% returns, a drawdown of just 10% cuts the average annual compound growth rate by 50%. Furthermore, it then requires a 30% return to regain the average rate of return required. In reality, chasing returns is much less important to your long-term investment success than most believe.
Here is another way to view the difference between what was “promised,” versus what “actually” happened. The chart below takes the average rate of return, and price volatility, of the markets from the 1960’s to present and extrapolates those returns into the future.
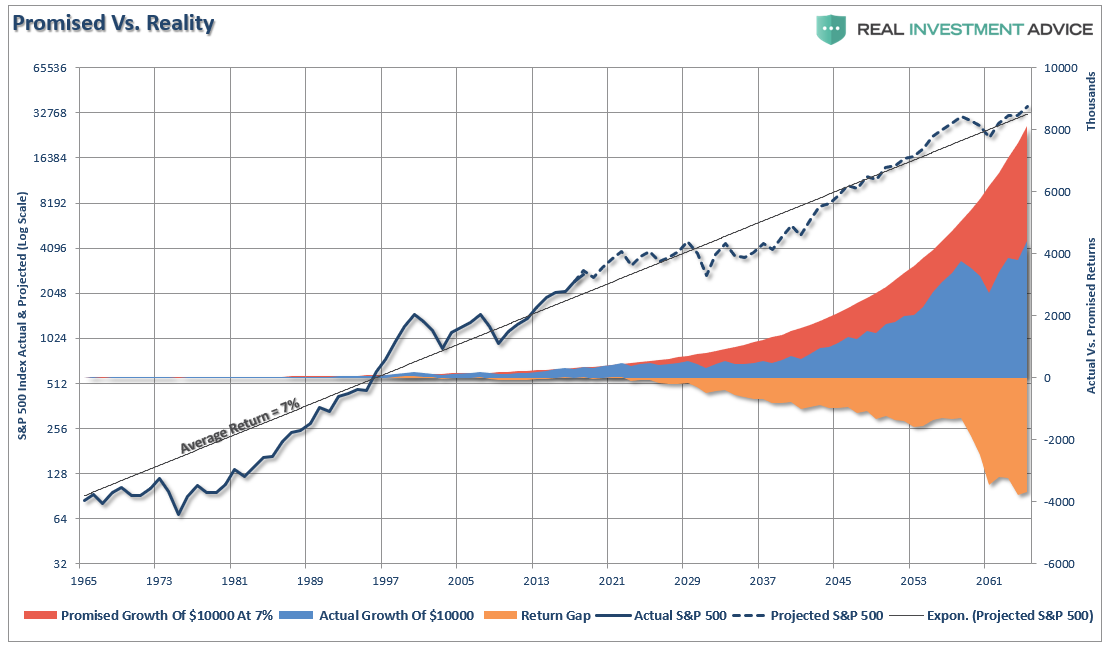
When imputing volatility into returns, the differential between what investors were promised (and this is a huge flaw in financial planning) and what actually happened to their money is substantial over the long-term.
The second point, and probably most important, is that YOU DIED long before you realized the long-term average rate of return.
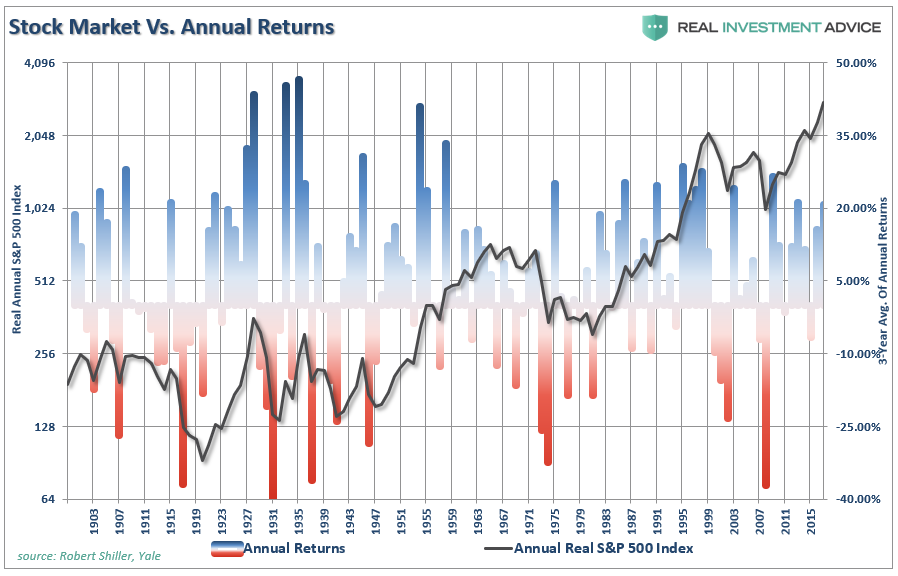
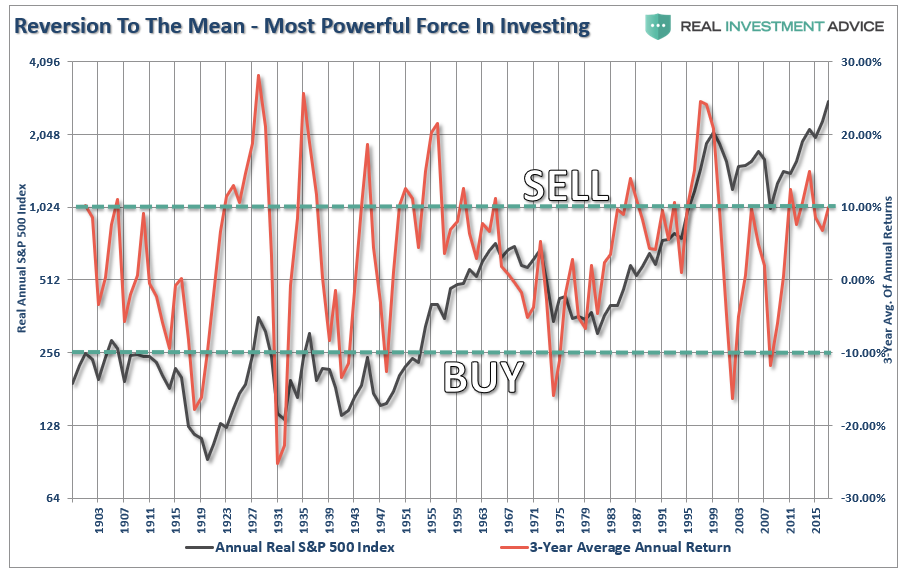
The chart below shows the S&P 500 as compared to annualized returns and the average of market returns since 1900. Over the last 118 years, the market has NEVER produced a 6% every single year even though the average has been 6.87%.
However, assuming that markets have a set return each year, as you could expect from a bond, is grossly flawed. While there are many years that far exceeded the average of 6%, there are also many that haven’t. But then again, this is why 6% is the “average” and NOT the “rule.”
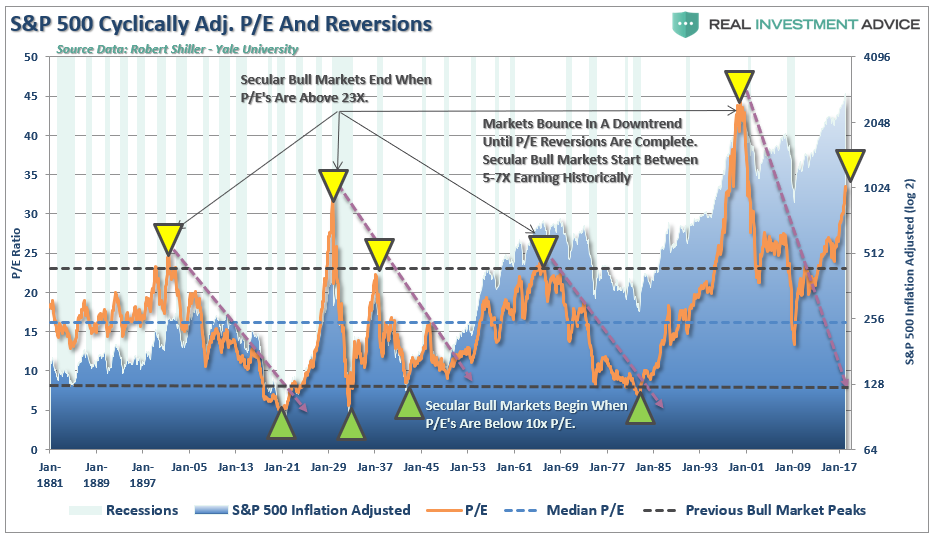
Secondly, and more importantly, the math on forward return expectations, given current valuation levels, does not hold up. The assumption that valuations can fall without the price of the markets being negatively impacted is also grossly flawed. History suggests, as shown in the next chart, that valuations do not fall without investment returns being negatively impacted to a large degree.
So, back to the “math” to prove this is true.
If we assume that despite the weak economic growth at present, the Federal Reserve is successful at getting nominal GDP back up to a historical growth rate of 6.3% annually. While this is not realistic if you look at the data, when markets are near historical peaks, assumptions tend to run a bit wild. Unfortunately, such assumptions have tended to have rather nasty outcomes. But I digress.
If we use a market cap / GDP ratio of 1.25 and an S&P 500 dividend yield of just 2%, what might we estimate for total returns over the coming decade using John Hussman’s formula?
(1.063)(0.63/1.25)^(1/10) – 1.0 + .02 = 1.3% annually.
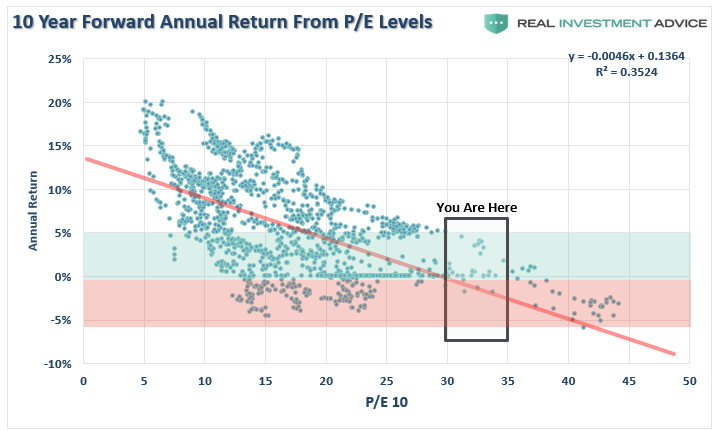
We can confirm that math by simply measuring the forward TOTAL return of stocks over the next 10-years from each annual valuation level.
Forward 20-year returns do not get a whole lot better.
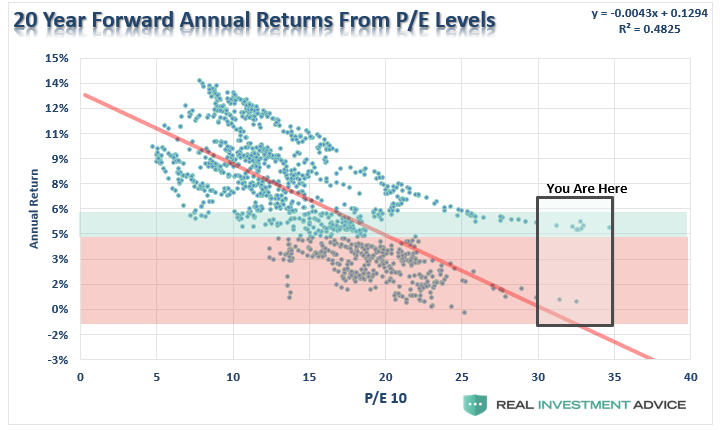
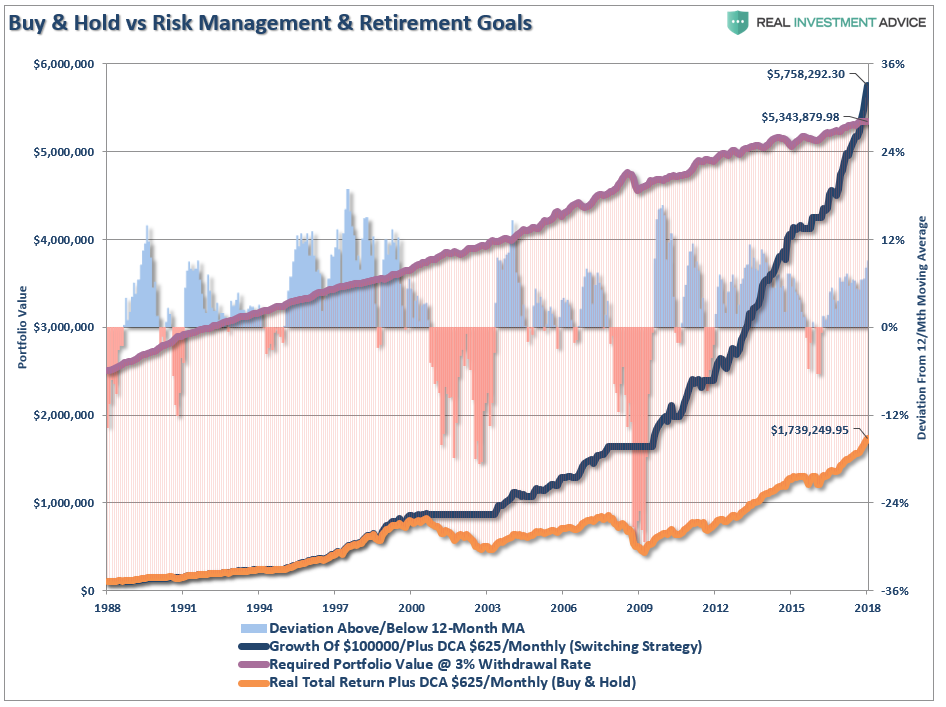
But even if you are optimistic, and you do manage to eek out forward returns of 5-6% over the next 20-years, you will never reach your financial goals due to the inherent destruction of capital along the way. (See “You Should Never Time The Market?”)
John Hussman once penned:
“Extraordinary long-term market returns come from somewhere. They originate in conditions of undervaluation, as in 1950 and 1982. Dismal long-term returns also come from somewhere – they originate in conditions of severe overvaluation. Today, as in 2000, and as in 2007, we are at a point where ‘this’ is like this. So ‘that’ can be expected to be like that.”
Nominal GDP growth is likely to be far weaker over the next decade. This will be due to the structural change in employment, rising productivity which suppresses real wage growth, still overly leveraged household balance sheets which reduce consumptive capabilities and the current demographic trends.
Most mainstream analysis makes sweeping assumptions that are unlikely to play out in the future. The market is extremely volatile which exacerbates the behavioral impact on forward returns to investors and the most recent Dalbar Study of investor behavior shows this to be the case. Over the last 30-years, the S&P 500 has had an average return of 10.16% while equity fund investors had a return of just 3.98%.
So much for the 6% return assumptions in financial plans.
This has much to do with the simple fact that investors chase returns, buy high, sell low and chase ethereal benchmarks. (Read “Why You Shouldn’t Benchmark Your Portfolio”) The reason that individuals are plagued by these emotional behaviors is due to well-meaning articles espousing stock ownership at cyclical valuation peaks.
Sure, it is entirely possible the current cyclical bull market is not over…yet.
Momentum driven markets are hard to kill in the latter stages particularly as exuberance builds. However, they do eventually end. That is unless the Fed has truly figured out a way to repeal economic and business cycles altogether. As we enter into the ninth year of economic expansion we are likely closer to the next contraction than not. This is particularly the case as the Federal Reserve continues to build a bigger economic void in the future by pulling forward consumption through its monetary policies.
Will the market likely be higher a decade from now? A case can certainly be made in that regard. However, if interest rates or inflation rise sharply, the economy moves through a normal recessionary cycle, or if Jack Bogle is right – then things could be much more disappointing. As Seth Klarman from Baupost Capital once stated:
“Can we say when it will end? No. Can we say that it will end? Yes. And when it ends and the trend reverses, here is what we can say for sure. Few will be ready. Few will be prepared.”
We saw much of the same mainstream analysis at the peak of the markets in 1999 and 2007. New valuation metrics, IPO’s of negligible companies, valuation dismissals as “this time was different,” and a building exuberance were all common themes. Unfortunately, the outcomes were always the same.
“History repeats itself all the time on Wall Street” – Edwin Lefevre
Lance Roberts

Lance Roberts is a Chief Portfolio Strategist/Economist for Clarity Financial. He is also the host of “The Lance Roberts Show” and Chief Editor of the “Real Investment Advice” website and author of “Real Investment Daily” blog and “Real Investment Report“. Follow Lance on Facebook, Twitter and Linked-In