Wolf Richter wolfstreet.com, www.amazon.com/author/wolfrichter
“Recent home buyers could be facing negative equity”: CoreLogic.
In Sydney, Australia’s largest property market and Petri dish for one of the world’s biggest housing bubbles, home prices fell 4.6% in June compared to a year ago, with house prices down 6.2%, and prices of condos (“units” as they’re called) down 0.7%, according to CoreLogic. The most expensive sector got hit the hardest: in the top quartile of home sales, prices fell 7.3%. In the nine months since the peak in September, the overall Daily Home Value Index has fallen 5.0%:
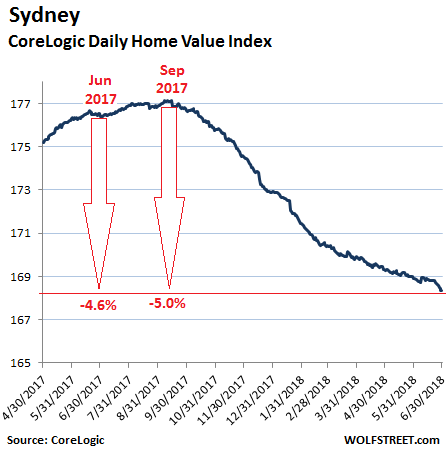
But it had been one heck of a boom in Sydney, where home prices had jumped over 80% from the end of 2009 through the peak in September last year. Even during the big-bad Global Financial Crisis, they’d only dipped 4.6%.
So the market is changing, and the denying has stopped. Australian banks are getting put through the wringer by the Royal Commission with ongoing revelations of an ever longer list of misdeeds, particularly in the mortgage sector.
The Australian Prudential Regulation Authority (ARPA), which is supposed to regulate the financial services industry, put in place some macroprodential measures to tamp down on the housing bubble, and they’re finally having an impact. Banks are suddenly focusing on borrowers’ debt-to-income ratios and other specifics, rather than just the assurance that home prices will always rise. They’re under investigation, and they’re tightening credit. And investors – a huge force in the market – have suddenly lost their appetite for property speculation, and banks have lost their appetite for funding them.
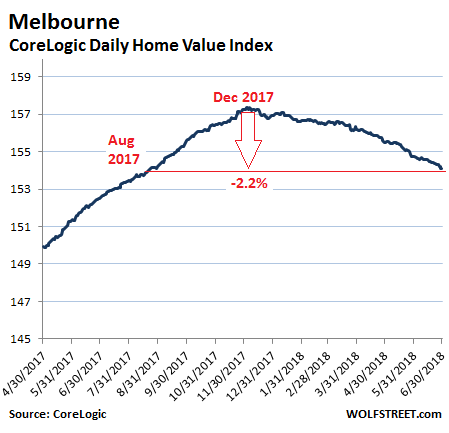
Melbourne lags a few months behind Sydney. Home prices in Melbourne peaked in December 2017 and have since declined 2.1%, but are still up 1.0% compared to a year ago. In the upper quartile of sales, property prices already dropped 2.5% from a year ago. The overall index is now back where it had last been in August 2017.
For the other three capital cities, the situation is mixed. In Brisbane, home prices ticked up 1.2% from a year ago and in Adelaide 1.1%. But in Perth, home prices have been declining since late 2014, when Western Australia got hit by the mining bust. In June, the CoreLogic index fell 2.1% from a year earlier, with houses down 1.7% and condos down 3.7%.
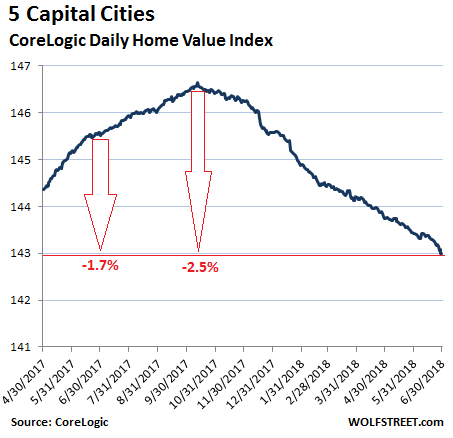
For the five capital cities in aggregate, the index was down 1.7% in June from a year ago. May (when the index was down 1.1%) had been the first month with an annual decline since October 2012, according to CoreLogic. The index has now declined month-to-month for nine months in a row and is down 2.5% from the peak in October last year:
But these are just the initial signs that the market is turning. Home prices remain 32% higher than five years ago, according to Corelogic research director Tim Lawless. Seen from a different perspective: there’s still a lot of air underneath these prices.
And suddenly there’s the prospect that “recent home buyers could be facing negative equity,” he said:
“Tighter finance conditions and less investment activity have been the primary drivers of weaker housing market conditions, and we don’t see either of these factors relaxing over the second half of 2018, despite APRA’s 10% investment speed limit being lifted this month.”
A large part of the home sales are via auctions that take place, mediatized and televised, in front of the home. This is supposed to whip current and future home buyers into frenzy. Every Monday, the auction results are reported with great fanfare. The key number everyone watches as sort of a real-time measure of the housing market is the “clearance rate.” It’s an indication of the percentage of homes that sold over the weekend either at auction or before the auction, compared to the homes that had been scheduled for auction.
During the boom times until late last year, clearance rates had been high. From 2013 through 2016 in Sydney, they’d mostly been in the 70% to 80% range. Last year, they began to drift lower and late last year fell below 60%, something that happened only a couple of times since 2012. And clearance rates have plunged further. This weekend:
- Sydney: 56%, down from 68% a year ago
- Melbourne: 60%, down from 71% a year ago
- Brisbane: 38%, down from 52% a year ago
- Adelaide: 55%, down from 61% a year ago
- Perth: 25%, down from 40% a year ago
CoreLogic summarizes in its auction report:
The 2018 auction market so far has demonstrated the weakening property market, with the success rate of auctions continuing to fall through the first half of the year; returning the lowest weekly clearance rates seen since 2012 as property values decline in turn.
In Canada, the housing bubbles in Toronto and Vancouver have been on a similar track. Locking back on the wild party times, the public mortgage insurer’s massive survey of recent homebuyers reveals all. Read… Foreign Buyers Made Me Do It: Canada Reflects Back on its Housing Bubble