Wolf Richter wolfstreet.com, www.amazon.com/author/wolfrichter
Chicago’s rents in free-fall, Washington DC’s suddenly plunge, New York’s fall to third place. But rents soar in Southern California and other parts. Bay Area and Seattle “mixed.”
Four observations first:
One, New York City’s median asking rent for two-bedroom apartments – long the second-highest in the country, after San Francisco – was surpassed in May for the first time by Los Angeles. Two factors: 2-BR median asking rent in New York City plunged nearly 20% from the peak in March 2016, while it soared in Los Angeles.
These asking rents do not include “concessions,” such as “1 month free” or “2 months free.” Concessions have reached record levels in New York City.
Two, Chicago rents have lost their grip. In September 2016, Chicago was still in eighth place among the 100 most expensive major metros in the US. In May, 1-BR rents fell to 17th place, bypassed by Providence, RI, and 2-BR rents were in 16th place, after plunging 27% and 28% from their peaks in the fall of 2015.
The dynamics in Chicago are, let’s say, a little special. There has been plenty of new construction. At the same time, the population has been declining as tax burdens are growing and as the city is very slowly traipsing toward what may become the largest municipal bankruptcy filing in the US.
Three, Honolulu rents are still struggling to find a bottom, with 1-BR down 19% from their peak in March 2015 and 2-BR rents down 25% from January 2015.
And four, rents in Washington DC are suddenly – did someone flick the &#@$* switch? – in major drop-off mode: 1-BR rents are down 8.5% from their peak last December and 2-BR rents are down 17% from their peak last August. Wow, that was fast.
At the same time, even as rents come unglued in some cities, in others they’re soaring by the double digits, from Southern California to less expensive markets in the middle of the country.
These are median asking rents in multifamily apartment buildings, including new construction, as they appeared in active listings in cities across the US. Single-family houses for rent are not included. Also not included are studios and units with more than two bedrooms. The data has been gathered by Zumper in its National Rent Report.
In San Francisco, the most expensive major rental market in the US, the median asking rent for 1-BR apartments rose 3.6% year-over-year to $3,490 in May, but remains down 4.9% from the peak in October 2015. For 2-BR apartments, it rose 2.2% year-over-year to $4,600 but remains down 8.0% from the peak in October 2015.
There’s plenty of supply in San Francisco. Zillow lists 1,656 apartments for rent at the moment, up 45% from the 1,149 listed in August 2016. This is not a big city. There are just 387,000 housing units in total. But here is the problem:
The cheapest units with bath (not counting rooms without bath) listed on Zillow today is a basic studio in Chinatown, for $1,100. There are only 59 units listed with an asking rent of less than $2,000. But 880 listings, or about half of the total, sport asking rents of over $4,000 (including 3-BR and up that are not reflected in Zumper’s data). Hence our “Housing Crisis.” It’s not a crisis of availability but of affordability.
This issue of availability versus affordability is playing out in other expensive markets as well.
The table below shows the 16 of the 100 most expensive major rental markets in the US. The shaded area shows peak rents and the movements since then. But I cheated. To keep Chicago on the list without expanding the list to 17, I left Providence off, whose 1-BR asking rent would have been in 16th place, and Chicago’s would have been in 17th place. In 2-BR rents, Chicago is still in 16th place. If Chicago’s ranking continues to drop, I will have to restrategize the list. The black bold “0%” in the shaded area means that these markets set new records in May:
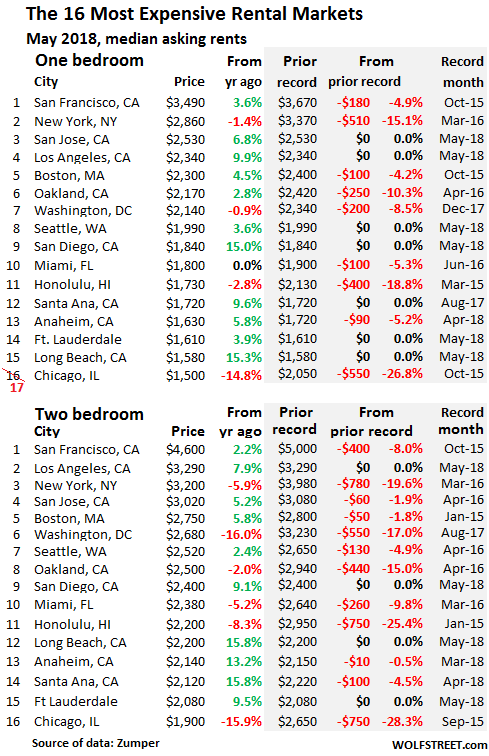
Seattle is a saga of its own. It has possibly the largest condo- and apartment-tower construction boom in the nation. This is a huge onslaught of supply, most of it focused on the high end, in a vibrant economy. Under these supply and affordability pressures, there were periods when rents started skittering lower. But 1-BR rents just now set a new record, even as 2-BR rents remain down nearly 5% from the peak in April 2016. This is perhaps a sign that demand is weakening for the more expensive units as people make do with smaller ones.
Southern California has five cities on the list: Los Angeles, San Diego, Santa Ana, Anaheim, and Long Beach. In all of them, rents are booming, with double-digit gains in the 2-BR category in Long Beach, Anaheim, and Santa Ana.
Of the three Bay Area cities on the list, rents are down from the respective peaks in two: San Francisco and Oakland. But in San Jose, the situation is mixed, with the median 1-BR asking rent setting a record in May, but with the 2-BR rent down a tad from the peak in April 2016, similar to Seattle.
Mixed, shaken, stirred, and averaged out, all these data points form a smooth nationwide average: Across the US, the median asking rent for 1-BR apartments rose 3.0% to $1,198 in May, compared to a year ago; the median asking rent for 2-BR apartments rose 3.2% from a year ago to $1,436.
The table below shows Zumper’s list of the 100 most expensive major rental markets in the US, by median asking rents for 1-BR and 2-BR units in May, and their percentage changes compared to a year ago (use browser search box to find a city).
Down in 98th place, you’ll find Tulsa. In 1986, in one of my moves back to Tulsa, I paid $460 in rent for a one-bedroom apartment. It was new construction, and I was one of the first to move in. Today, 32 years later, the median 1-BR asking rent is $600. This is what happened: The city went through a horrible time starting in 1983, following the oil bust, until well into the 1990s. It lost about 15% of its jobs as the oil business moved to Houston and never came back. By 1988, the landlord had dropped my rent to $350; they were still trying to fill the complex! I then bought a condo in a high-rise, from a bank that had ended up with all the units on that floor. A year later, the bank collapsed, and the FDIC ended up selling the rest of the units.
Also compare these cities to The Most Splendid Housing Bubbles in the US.
| Pos. | City | 1-BR rent | Y/Y % | 2-BR rent | Y/Y % |
| 1 | San Francisco, CA | $3,490 | 3.6% | $4,600 | 2.2% |
| 2 | New York, NY | $2,860 | -1.4% | $3,200 | -5.9% |
| 3 | San Jose, CA | $2,530 | 6.8% | $3,020 | 5.2% |
| 4 | Los Angeles, CA | $2,340 | 9.9% | $3,290 | 7.9% |
| 5 | Boston, MA | $2,300 | 4.5% | $2,750 | 5.8% |
| 6 | Oakland, CA | $2,170 | 2.8% | $2,500 | -2.0% |
| 7 | Washington, DC | $2,140 | -0.9% | $2,680 | -16.0% |
| 8 | Seattle, WA | $1,990 | 3.6% | $2,520 | 2.4% |
| 9 | San Diego, CA | $1,840 | 15.0% | $2,400 | 9.1% |
| 10 | Miami, FL | $1,800 | 0.0% | $2,470 | -1.2% |
| 11 | Honolulu, HI | $1,730 | -2.8% | $2,200 | -8.3% |
| 12 | Santa Ana, CA | $1,720 | 9.6% | $2,120 | 15.8% |
| 13 | Anaheim, CA | $1,630 | 5.8% | $2,140 | 13.2% |
| 14 | Fort Lauderdale, FL | $1,610 | 3.9% | $2,080 | 9.5% |
| 15 | Long Beach, CA | $1,580 | 15.3% | $2,200 | 15.8% |
| 16 | Providence, RI | $1,520 | 14.3% | $1,590 | 13.6% |
| 17 | Chicago, IL | $1,500 | -14.8% | $1,900 | -15.9% |
| 18 | Philadelphia, PA | $1,490 | 8.0% | $1,700 | 8.3% |
| 19 | Denver, CO | $1,470 | 15.7% | $1,980 | 15.8% |
| 20 | Portland, OR | $1,450 | 4.3% | $1,750 | 9.4% |
| 21 | Atlanta, GA | $1,420 | 8.4% | $1,810 | 9.7% |
| 22 | Minneapolis, MN | $1,410 | 15.6% | $1,850 | 9.5% |
| 22 | New Orleans, LA | $1,410 | 6.0% | $1,550 | -3.1% |
| 24 | Baltimore, MD | $1,400 | 10.2% | $1,610 | 15.0% |
| 25 | Nashville, TN | $1,390 | 13.9% | $1,470 | 6.5% |
| 26 | Dallas, TX | $1,310 | 1.6% | $1,790 | 1.7% |
| 27 | Houston, TX | $1,300 | 14.0% | $1,610 | 14.2% |
| 27 | Madison, WI | $1,300 | 13.0% | $1,390 | 14.9% |
| 29 | Orlando, FL | $1,270 | 15.5% | $1,460 | 15.0% |
| 30 | Charlotte, NC | $1,250 | 11.6% | $1,370 | 4.6% |
| 30 | Scottsdale, AZ | $1,250 | 4.2% | $1,890 | -5.5% |
| 32 | Sacramento, CA | $1,190 | 4.4% | $1,400 | 9.4% |
| 33 | Austin, TX | $1,180 | 12.4% | $1,470 | 9.7% |
| 34 | Irving, TX | $1,160 | 3.6% | $1,550 | 8.4% |
| 35 | Tampa, FL | $1,140 | 10.7% | $1,380 | 12.2% |
| 36 | Plano, TX | $1,130 | 3.7% | $1,510 | 4.1% |
| 37 | Aurora, CO | $1,110 | 11.0% | $1,450 | 6.6% |
| 38 | Durham, NC | $1,100 | 15.8% | $1,270 | 14.4% |
| 38 | Newark, NJ | $1,100 | 11.1% | $1,380 | 15.0% |
| 38 | Pittsburgh, PA | $1,100 | 0.9% | $1,350 | -1.5% |
| 41 | Buffalo, NY | $1,090 | 14.7% | $1,270 | 1.6% |
| 41 | Fort Worth, TX | $1,090 | 14.7% | $1,300 | 15.0% |
| 41 | Gilbert, AZ | $1,090 | 7.9% | $1,360 | 4.6% |
| 44 | St Petersburg, FL | $1,080 | 14.9% | $1,550 | 6.9% |
| 45 | Chandler, AZ | $1,050 | 10.5% | $1,280 | 9.4% |
| 45 | Henderson, NV | $1,050 | 8.2% | $1,220 | 9.9% |
| 45 | Richmond, VA | $1,050 | 11.7% | $1,260 | 6.8% |
| 45 | Salt Lake City, UT | $1,050 | 15.4% | $1,390 | 15.8% |
| 49 | Virginia Beach, VA | $1,040 | 7.2% | $1,200 | 1.7% |
| 50 | Chesapeake, VA | $1,010 | 9.8% | $1,200 | 1.7% |
| 51 | Raleigh, NC | $1,000 | -1.0% | $1,180 | 1.7% |
| 52 | Phoenix, AZ | $980 | 10.1% | $1,190 | 10.2% |
| 53 | Kansas City, MO | $970 | 14.1% | $1,090 | 10.1% |
| 54 | Jacksonville, FL | $950 | 9.2% | $1,090 | 0.0% |
| 55 | Milwaukee, WI | $930 | 14.8% | $1,090 | 16.0% |
| 56 | Colorado Springs, CO | $920 | 15.0% | $1,150 | 4.5% |
| 57 | Las Vegas, NV | $910 | 15.2% | $1,100 | 12.2% |
| 57 | Mesa, AZ | $910 | 13.8% | $1,100 | 13.4% |
| 59 | Baton Rouge, LA | $900 | 8.4% | $960 | 1.1% |
| 59 | Boise, ID | $900 | 5.9% | $950 | 4.4% |
| 61 | Fresno, CA | $890 | 8.5% | $1,090 | 11.2% |
| 61 | San Antonio, TX | $890 | 8.5% | $1,150 | 10.6% |
| 63 | Syracuse, NY | $880 | 15.8% | $1,030 | 3.0% |
| 64 | Anchorage, AK | $860 | -1.1% | $1,110 | -7.5% |
| 64 | Laredo, TX | $860 | 14.7% | $990 | 15.1% |
| 66 | Corpus Christi, TX | $850 | -2.3% | $1,090 | 9.0% |
| 66 | Louisville, KY | $850 | 3.7% | $980 | 12.6% |
| 66 | Omaha, NE | $850 | 11.8% | $1,050 | 15.4% |
| 66 | Reno, NV | $850 | 13.3% | $1,270 | 15.5% |
| 70 | Des Moines, IA | $840 | 12.0% | $880 | 3.5% |
| 70 | Rochester, NY | $840 | 15.1% | $980 | 15.3% |
| 72 | Cincinnati, OH | $820 | 15.5% | $1,110 | 15.6% |
| 73 | Norfolk, VA | $810 | 15.7% | $970 | 7.8% |
| 74 | Cleveland, OH | $800 | 15.9% | $880 | 14.3% |
| 75 | Arlington, TX | $780 | 14.7% | $1,060 | 15.2% |
| 75 | Bakersfield, CA | $780 | 4.0% | $900 | 1.1% |
| 75 | Knoxville, TN | $780 | 14.7% | $920 | 15.0% |
| 75 | Lexington, KY | $780 | -1.3% | $950 | 0.0% |
| 79 | St Louis, MO | $770 | 14.9% | $1,120 | 15.5% |
| 80 | Augusta, GA | $760 | 15.2% | $840 | 10.5% |
| 80 | Chattanooga, TN | $760 | 15.2% | $810 | 9.5% |
| 80 | Winston Salem, NC | $760 | 15.2% | $820 | 15.5% |
| 83 | Tallahassee, FL | $750 | 15.4% | $850 | 9.0% |
| 84 | Glendale, AZ | $740 | 5.7% | $960 | 6.7% |
| 85 | Columbus, OH | $730 | 2.8% | $1,050 | 7.1% |
| 86 | Greensboro, NC | $710 | 9.2% | $840 | 7.7% |
| 86 | Memphis, TN | $710 | 14.5% | $770 | 14.9% |
| 88 | Spokane, WA | $700 | 7.7% | $860 | 0.0% |
| 89 | Indianapolis, IN | $690 | 15.0% | $810 | 15.7% |
| 90 | Oklahoma City, OK | $680 | 9.7% | $830 | 12.2% |
| 91 | Lincoln, NE | $670 | -5.6% | $890 | 7.2% |
| 92 | Albuquerque, NM | $650 | 8.3% | $840 | 7.7% |
| 93 | El Paso, TX | $640 | 3.2% | $760 | -1.3% |
| 93 | Shreveport, LA | $640 | 14.3% | $710 | 9.2% |
| 95 | Tucson, AZ | $630 | -4.5% | $830 | -2.4% |
| 95 | Wichita, KS | $630 | 14.5% | $740 | 12.1% |
| 97 | Detroit, MI | $610 | 15.1% | $690 | 15.0% |
| 98 | Akron, OH | $600 | 13.2% | $740 | 10.4% |
| 98 | Tulsa, OK | $600 | 1.7% | $760 | 2.7% |
| 100 | Lubbock, TX | $590 | 7.3% | $780 | 4.0% |