Wolf Richter wolfstreet.com, www.amazon.com/author/wolfrichter
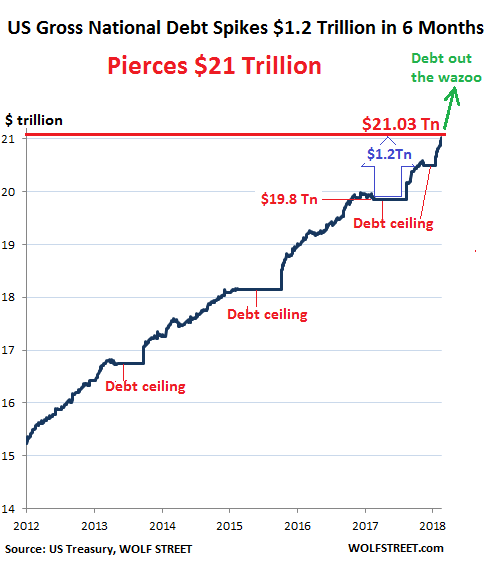
The US gross national debt jumped by $72.8 billion in one day, on Thursday, the Treasury Department reported Friday afternoon. This March 16 is a historic date of gloomy proportions, because on this date, the US gross national debt punched through the $21 trillion mark and reached $21.03 trillion.
Here’s the thing: On September 7, 2017, a little over six months ago, just before Congress suspended the debt ceiling, the gross national debt stood at $19.84 trillion.
In those six-plus months – 132 reporting days, to be precise – the gross national debt spiked by $1.186 trillion. I tell you, these dang trillions are flying by so fast, they’re hard to see. And we wonder: What was that? Where did it go?
Whatever it was and wherever it went, it added 6% to the gross national debt in just 6 months.
And with 2017 GDP at $19.74 trillion in current dollars, the gross national debt now amounts to 106.4% of GDP.
In the chart below, the flat spots are the various debt-ceiling periods. This is a uniquely American phenomenon when Congress forbids the Administration to borrow the money that it needs to borrow in order to spend it on the things that Congress told the Administration to spend it on via the appropriation bills. So that’s where we are, on this glorious day of March 16, 2018:
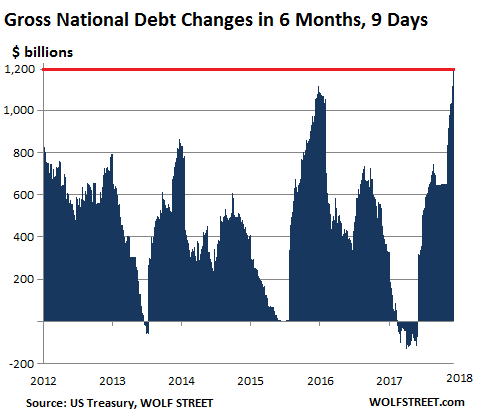
This was the largest spike in the gross national debt over a period of 132 reporting days, going back to 2011. Perhaps during the depth of the Financial Crisis, when all heck was breaking loose, and when credit was freezing up, and when millions of people lost their jobs, and when the government stopped receiving payroll deductions from them, and when capital gains turned into losses, and when corporations were drowning in red ink and not paying taxes either, in other words, when tax receipts collapsed due to the crisis, and expenditures for unemployment and other things jumped, well then the debt might have increased more sharply in a time span like this. But not since then.
This chart shows the changes in the gross national debt on a rolling 132-reporting-day basis, going back to 2011:
And this is happening in a booming economy when the debt shouldn’t increase at all as booming tax receipts would match, or more than match, government expenditures. But hey, not in this brave new world.
Despite the boom times – and they’re likely as good as they’re going to get – the government is already forecasting record issuance of net new Treasury debt in order to fund the surging deficits. And the market will have to absorb this debt, just as the Fed has started to unload Treasuries from its balance sheet.
US Gross National Debt Spikes $1.2 Trillion in 6 Months, Hits $21 Trillion – These Dang Trillions Are Flying By So Fast, They’re Hard To See.
Views: