There are three prominent measures of volatility: VIX for the S&P 500 index, TYVIX for the 10-year Treasury Note, and MOVE (Ml Option Volatility Estimate Index). All three show an interesting pattern. The stable volatility patterns prior to the massive Fed intervention starting in Q4 2007. That never ended.

Here is the massive Fed intervention and the US Treasury 10Y-3M curve.
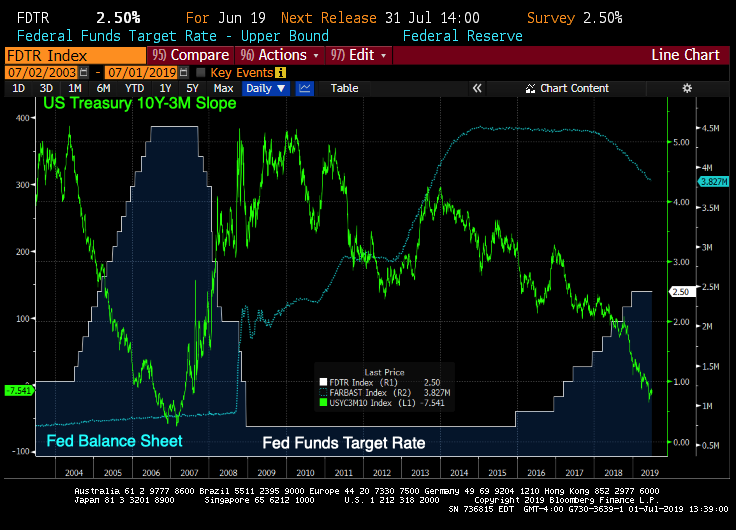
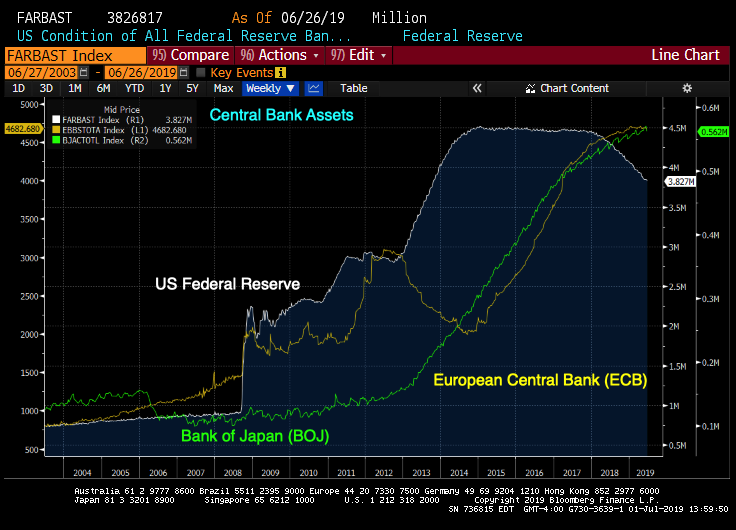
Nothing has been the same since the Q4 Fed (and other central bank) intervention to fight The Great Recession.
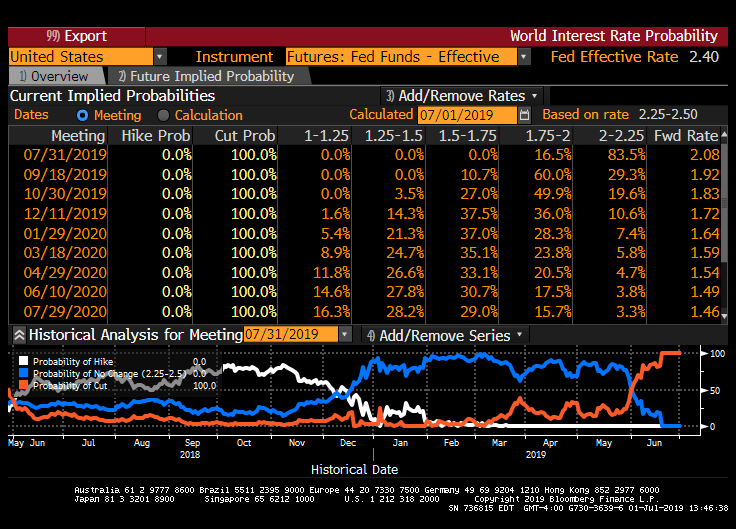
And we are back to rate cutting (according to Fed Funds Futures data) despite the jawboning (or “Talk-talk” from Fed members).
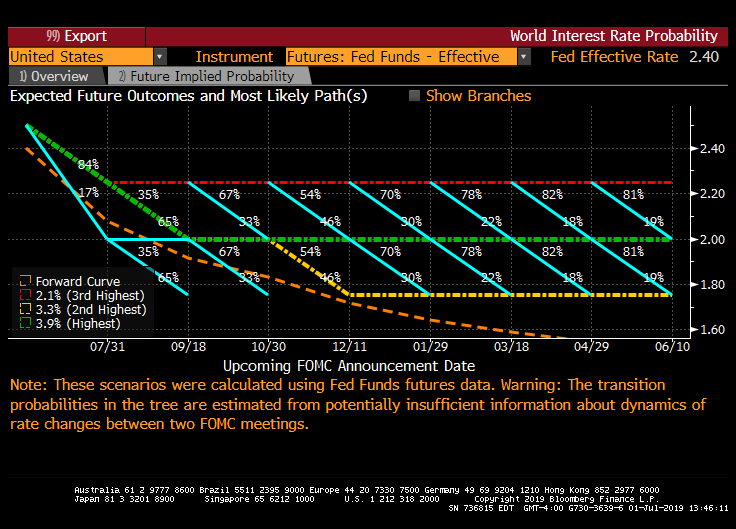
The expected path of interest rates (orange line) looks like a Viking ship.
Views: