Warning Signs Appear to Crop up Beneath Market’s Surface
The S&P 500 may be hovering near record highs, but the stock market may be weaker than it currently appears.
Warning sign under market’s surface? from CNBC.
One Of The Greats Just Warned The World Is Now Heading Into A “Perfect Storm”
On the heels of global troubles intensifying, today one of the greats just warned that the world is now heading into “a perfect storm.”
Overcoming Resistance
John Embry: “Eric, I must say that we have a much better tone to the gold and silver markets since we last spoke. They overcame massive resistance from the usual suspects to post impressive gains on both Friday of last week and Monday of this week…
Manipulators Hard At Work
John Embry continues: “On Friday, as gold was challenging to break through the critical resistance in the $1,300 area, some non-profit motivated seller sold over 20,000 contracts in roughly 2 minutes on the Comex, knocking the gold price back $12. To put that in perspective, some party sold over 2 percent of annual gold mine production in 2 minutes. That’s ridiculous.
However, gold’s rapid bounce back from a quiet August Friday indicates to me that the market is definitely changing character. On Monday, gold came out of the box strong, somewhat unusual in comparison to many recent Monday’s when the anti-gold Cartel put pressure on the price in order to diffuse any emerging excitement. From Friday’s Comex close to Monday’s, the price of gold rose by over 1.3 percent. By itself that is relatively impressive, but this rise occurred in spite of an increase in open interest of some 23,000 contracts, representing a notional 2.3 million ounces of gold. Any other commodity facing this sort of selling pressure would have buckled, indicating just how strong the gold and silver markets are in the process of becoming.
A Stock Market Correction Is Imminent

It’s not that the companies are doing poorly. They are actually topping estimates more than usual. It’s that investors aren’t rewarding them for beating estimates.
The other week I had a subscriber write in to me sharing this fact. Marco M. wrote:
“Hello, Chad. I just saw this on Yahoo Finance. Do you believe this would change behaviors on the great strategy you put together (which, by the way, I’m investing in)?”
Marco directed this question toward my Earnings Drift Alert service. My response was simply that our system does account for this very instance thanks to how it is designed.
But, in a broader sense, this anomaly, which hasn’t occurred since 2011, is a sign that a correction is looming.
Punished by Wall Street
During the second quarter this year, the underlying operations for companies were doing well.
According to FactSet, 73% of the companies that have reported so far have reported earnings per share above analyst estimates. This is above the five-year average of 68%. The earnings growth rate for the S&P 500 jumped to 10.2% from 6.4% at the end of June.
But the area of concern, as I mentioned, is that these stocks are not benefiting from their stellar earnings reports. Instead, Wall Street is actually punishing companies for strong earnings. Take a look:
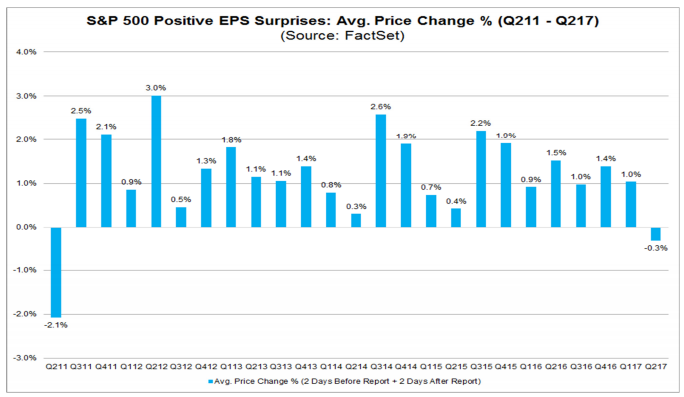
This chart shows the return from two days before earnings to two days after for every company that beat analyst earnings estimates.
As you can see, the latest quarter will be the first time since the second quarter in 2011 that returns declined for these companies.
A quick reminder about 2011, which was the last time this happened…
Bank of America; “This Could Get Ugly, We Think”
Instead of finding new and creative ways of BTFD, overnight the BofA credit team did something so few finance professionals bother with these days: they looked at fundamental data to reach a conclusion that is independent of how much AAPL stock the SNB will have to buy to send the Dow Jones green. Specifically, the bank looked at the liquidity situation in the bond market (specifically the IG space), and found that while for the time being there is little to worry about, once the central bank put melts away, that’s when the real test will take place. And, as BofA puts it bluntly, “this could get ugly, we think.”
As the bank’s credit strategist Hans Mikkelsen explains, high grade corporate bond trading has doubled over the post-crisis years (Figure 1). However, as the size of the market tripled that means the overall market has become less liquid due to a number of post-crisis changes, including financial regulation and most prominently the Volcker Rule, but also less leverage in the system. For example, while annual trading volumes in the HG corporate bond market were 135% of the size of the market back in 2006, that same tracking statistic is only 86% for 2017 (figure 2).

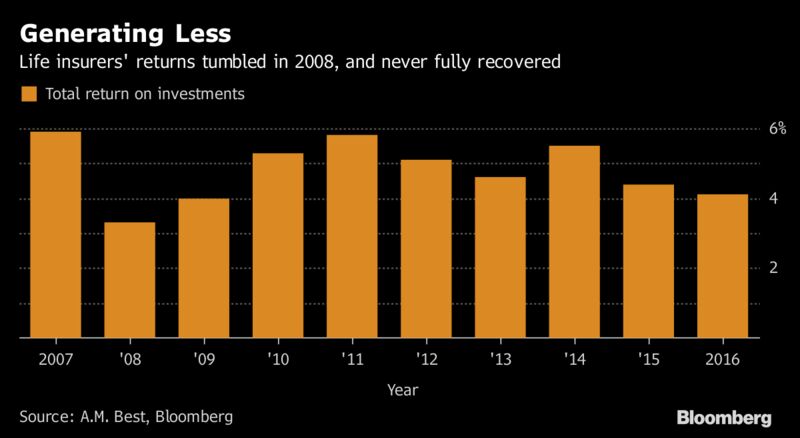
BlackRock Finds $5 Trillion Industry Is Now Riskier Than in ’08
-
Insurers bought up complex assets to lift returns after crisis
-
Industry’s push into alternative assets also provides benefits
Insurers got burned badly in the 2008 financial crisis. So almost a decade later, BlackRock Inc. scoured the industry’s $5 trillion in U.S. investments to figure out how they would fare if markets crash so hard again.
The answer: Worse.
The world’s largest money manager mined regulatory filings of more than 500 insurance companies and modeled their portfolios in a similar downturn. Their stockpiles — underpinning obligations to policyholders across the nation — would drop by 11 percent on average, according to its calculations. That’s significantly steeper, BlackRock estimates, than the group’s “mark-to-market” losses during the depths of the crisis.
The reason is pretty simple. Insurers needed to make up shortfalls after the crisis. But in a decade of low interest rates they had to venture beyond their traditional holdings of vanilla bonds. They now own vast amounts of stocks, high-yield debt and a variety of alternative assets — a bucket that can include hard-to-sell stakes in private equity investments, hedge funds and real estate.
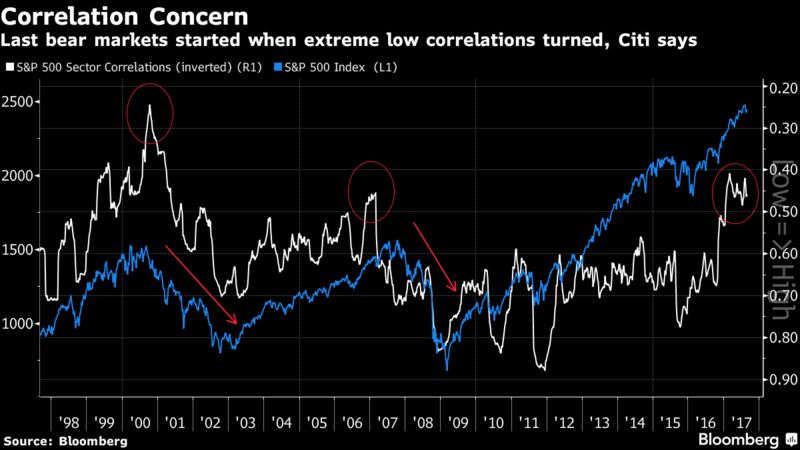
From Stocks to Bonds, Bear-Market Signals Multiplying
-
Correlations near levels consistent with last two downturns
-
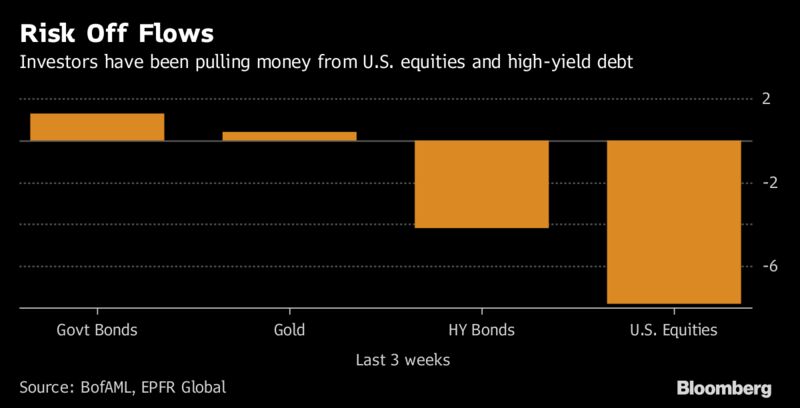
Fund flows favor government bonds as investors shun risk
Risks are stacking up for markets attempting to recover from the latest provocation by North Korea and the mounting damage of Tropical Storm Harvey.
Citigroup Inc. strategists including Jeremy Hale cite “worrying developments” that may signal the approach of a correction in stocks, while Commerzbank AG finds growing evidence of bearish sentiment in bond funds. Here are some of the red flags:
Correlations
The pairwise correlations between the S&P 500 and its industry sectors have fallen near levels that preceded the last two bear markets, according to the Citigroup strategists. The previous downturns in stocks started when correlations re-established themselves.
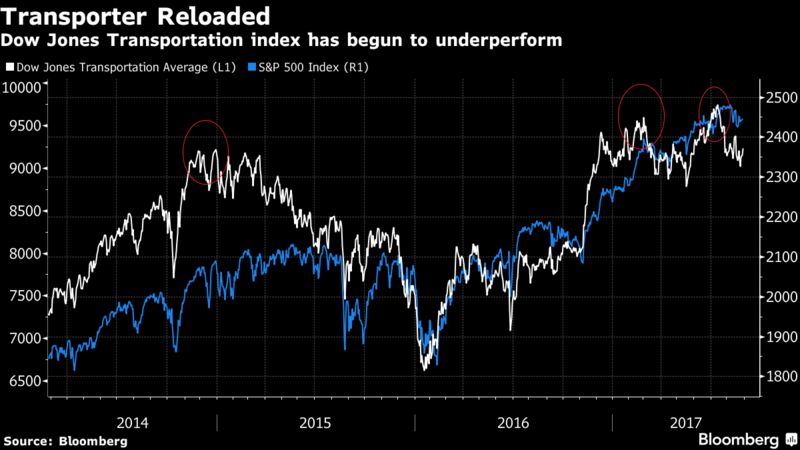
Transport Stocks
Underperforming transport stocks are another concern. The Dow Jones Transportation Average, a gauge of airline, railroad and trucking companies, has fallen about 5 percent from its July 14 high. The index’s decline from its 2014 peak led a similar move in the S&P 500 by about seven months.
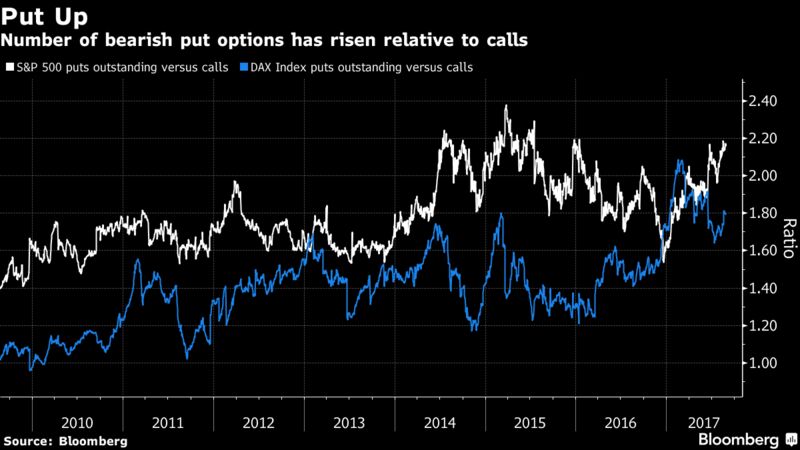
Bearish Bets
The ratio of outstanding puts to calls on the S&P 500 has risen to levels last seen in the late-2015 market sell-off, according to Richard Turnill, BlackRock Inc.’s chief investment strategist. The ratio for German stocks has also risen. The move to boost downside protection shows investors are getting nervous, he said.
Fund Flows
Fund flows show bond investors are also shunning risk. While high-yield funds suffer ‘considerable’ redemptions, cash has flowed into those that invest in government debt, according to Commerzbank strategists including Alexander Kramer and Ulrich Urbahn.
Venezuela is a shocking example of a society and country in COMPLETE AND TOTAL collapse – even cannibalism!!!! is now a problem!
But their stock market is hitting new, all-time highs.
Don’t expect anything different, here. I will be shocked if it were otherwise.
As long as the bigtime investors choose to ignore the signals, the crash isn’t going to happen.
A single billionaire putting some pocket change (a couple of millions, by his standards) into the market makes up for thousands of regular people leaving it.
Chances are the ultimate plan is for a coordinated effort of the NWO billionaires to dump all their stocks at the same time, before prices can react – then regular people with some savings invested in stocks will take the fall.
That said, I don’t think the point where they want to do that has come already. I have some stocks and I’ll keep them for a while longer.
My savings are currently roughly 50% gold and silver (to make sure there’s something of value that’s not going to collapse no matter what they do), 20% US stocks (there’s the risk that the point of collapse is closer than I think, but if I’m right, stock prices will go up for a while longer and dividends will be better than interest on bank accounts), 20% foreign stocks (a market collapse in the US is unlikely to affect Asian and European stocks a lot, and the collapse there will likely be later), 9% cash (easiest thing to have around, currently accepted everywhere, no risk of bank bail-ins), 1% in a bank account (mostly to cover quick expenses like credit card bills – make sure those are paid off in full whenever you can afford it, their interest rates are insane!).