And a special word on apparel sales, as a sign of our times.
By Wolf Richter for WOLF STREET.
Services are growing at a decent pace, though more slowly than a year ago. The labor market is the strongest in years, so consumer spending is growing at a good pace, including retail sales, driven by red-hot ecommerce sales. Where the economy is in trouble is in industrial goods and in the huge oil-and-gas sector which also drags down the manufacturing segments that supply it with heavy equipment, tech equipment, vehicles, chemicals, and the like. And I have a couple of special thoughts on the consumer side, concerning apparel sales.
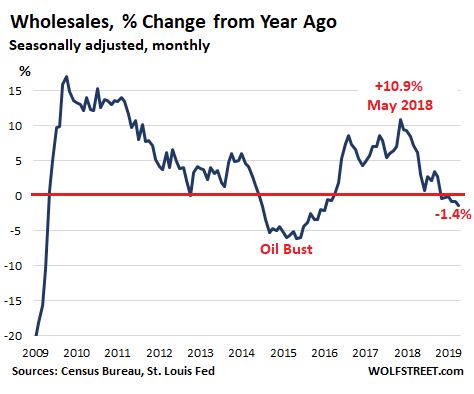
We’ll look at this situation via the detailed wholesale trade report by the Census Bureau, released today. Total wholesales in October fell 1.4% from October last year, to $494.3 billion, below where they’d first been in May 2018. It was the sixth month in a row of year-over year declines and the largest such decline since 2016, and it follows the boom last year when year-over-year sales growth peaked in May at nearly 11%:
The bigger year-over-year declines in 2015 and 2016 were driven largely by the collapse in oil prices and the bust in the US oil-and-gas sector, when many dozens of oil-and-gas drillers filed for bankruptcy. Plunging demand by that sector for manufactured goods – heavy equipment, tech products, specialty vehicles, chemicals, etc. – and the collapse of prices of petroleum and petroleum products helped pull down overall wholesales by over 5% during the time. The current oil bust, which is really phase 2 of the same Oil Bust, is a milder iteration.
The wholesale trade report tracks the movement of goods through the sales channel. Sales of services are not included. Wholesales are divided into two categories: durable goods such as industrial equipment or appliances; and nondurable goods such as groceries, apparel, and petroleum products (gasoline, diesel, etc.). The damage was spread over both categories.
Durable goods wholesales.
October 2018 had been an all-time record boom month, with $263 billion in durable goods wholesales, up 8.7% from prior year. October 2019 fell 1.9% from that lofty record, to $258 billion.
Among the categories there are four biggies, two of which rose year-over-year: Automotive, +2.6% to $42 billion (includes used vehicles and auto parts, but not new vehicles sold directly by manufacturers to dealers or fleets, thus bypassing wholesale channels); and Professional & commercial equipment, +2.3% to $47 billion. The remaining two biggies and several smaller categories booked wholesales that fell year-over-year:
Household appliances, electrical and electronic goods, -5.5% to $55 billion.Ninth month out of the 10 months this year of year-over-year declines. But this deterioration came off the steamy peak-spike in October 2018, which had been up 7% from Oct 2017, which in turn had been up 13% from October 2016 – the boom-years for these goods. October or November are the seasonal peaks in this category.
Machinery, equipment, and supplies, -1.7% to $42 billion. The third month in a row of year-over-year declines, after a huge boom in 2017 and 2018 peaking with 18% year-over-year gains in June, July, and August last year.
Among the smaller categories of durable goods were some other notable decliners:
Metals and minerals except petroleum, -12% to $15 billion, the sixth month in a row of year over year declines. This puts wholesales in the middle of the 10-year range, and back where they’d first been in 2006. Wholesales are measured in dollars, and so this category is heavily dependent on commodity prices of metals and minerals. There has been no growth since 2006 — just variations within a band, ranging from $10 billion to 16 billion a month.
Computers, peripherals, and software, -0.4% to $25 billion. Sales had been growing with large seasonal fluctuations (the high point is always in December, for tax reasons) and had been outright booming in 2017 and 2018 with year over year growth rates exceeding 10% in many months, topping out at 18% in October 2018. But this boom has now fizzled.
Miscellaneous durable goods, -7.8% to $20.5 billion. The all-time peak was in August 2011 at $26 billion, and the prior peak was in July 2008 at $24 billion. In October, sales in this category were back where they’d first been in May 2007.
Nondurable goods.
Wholesales in nondurable goods ticked down 0.7% year-over-year to $273 billion. In this category, there are three biggies. Two booked rising sales:Drugs, the legal variety, +4.1% to $65 billion; and Groceries, +4.8% to $59 billion. One, petroleum and petroleum products, booked sharply falling sales.
Petroleum and petroleum products, -9.2% to $59 billion. A year-over-year decline of $6 billion, largely based on the plunge in oil prices that started all over again September 2018. Note that the year-over-year decline in total wholesales, durables and nondurables combined, was also $6 billion. The decline in wholesales of petroleum and petroleum products, based on plunging prices, was the largest driver in the overall decline in wholesales. Had this category been flat, overall wholesales would have been flat as well.
During the bottom of the Oil Bust in February 2016, wholesales of petroleum and petroleum products had collapsed by 63%, to $28 billion, from about $75 billion a month in mid-2014, due to the collapsed price.
The rest of the nondurables categories that booked declines are much smaller, but together they also weigh on the scale:
- Paper products, -7.5% to $8.2 billion
- Apparel, -5.0% to $14.9 billion.
- Chemicals, -1.7% to $12 billion
- nondurables, -3.1% to $21 billion.
A special word on apparel sales, a sign of our times.
Apparel wholesales peak in October, in preparation for holiday shopping season. October 2017 had been the all-time peak for apparel. Wholesales have fallen 12% since then. But apparel retail sales in the US are doing well overall – they’re just shifting to the internet.
According to a report by Digital Ecommerce, in 2017, 30.6% of all apparel sales in the US were conducted online; in 2018, ecommerce’s share of apparel sales had grown to 34.4%. Given the 18.5% growth rate of online apparel sales in 2018, it is likely that in 2019, around 40% of all apparel sales will be conducted online.
Outsourcing of apparel manufacturing to cheap countries, with sales shifting increasingly to the internet and cutting out some middlemen, has for years put downward pressure on apparel retail prices.
In addition, direct sales that are bypassing wholesale channels are increasing. These are sales by manufacturers overseas to consumers in the US, via platforms such as Amazon and eBay, or via branded sites such as Nike’s, that are selling imported merchandise directly to consumers, cutting out classic wholesale channels and all US middlemen. These direct-sales are captured in ecommerce sales, but they don’t show up here in the wholesale data.
So, with many consumer goods categories, such as apparel – and even household appliances and electronics, the category above that showed declining wholesales – the sales channels are changing, with increasingly large amounts of merchandise bypassing wholesale channels and even classic US retailers, and being sold directly by the manufacturer or the brand to consumers.