Wolf Richter wolfstreet.com, www.amazon.com/author/wolfrichter
As “affordability challenges” hit new vehicles, consumers switch to used, prices spike to record, inflation psychology sets in.
For a brain-twisting phenomenon, amuse yourself for a moment with the Consumer Price Index for used cars and trucks. It shows that there has been 0% inflation since 1994 in used cars and trucks, despite actual prices having soared. So, yes, the CPI for used vehicles in June, as reported by the Bureau of Labor Statistics, fell 0.7% from June a year ago and is where it had been in April 1994:
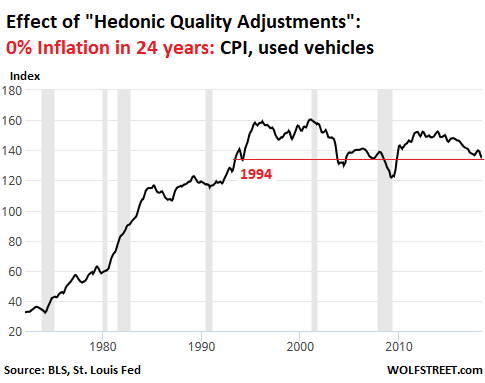
This absurdity of 0% inflation since 1994 is caused largely by the BLS’s relentless and passionate application “hedonic quality adjustments,” which adjust prices for the costs of a model’s new equipment and quality improvements, such as, to quote: reliability, durability, safety, fuel economy, maneuverability, speed, acceleration, deceleration, carrying capacity, and comfort or convenience.
For a more sobering sense of reality, let’s head to the Manheim Used Vehicle Value Index. Manheim is the largest auto auction company in North America. Annually, about 8 million used vehicles – rental cars, lease turn-ins, repos, etc. – are sold at its physical and online venues. This index, based on these wholesale prices, is adjusted for mix, mileage, and seasonality.
On this basis, used vehicle prices jumped 5.1% in July from a year ago. The index, at 136.9, hit “the highest level ever for the series,” Manheim said. And look at that spike:
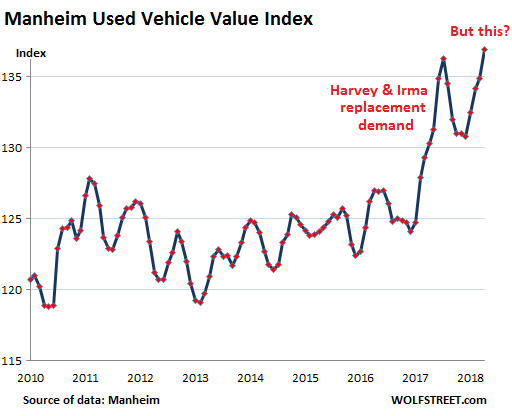
The index is up 16.4% from January 2010. Over the same period, the CPI for used cars and trucks, pictured at the top, fell 4.3%.
The index stayed in the same range between 2010 and April 2017, and suddenly, in May 2017, BAM. This was before the hurricanes. Then in late August and September, Hurricanes Harvey and Irma created a lot of “replacement demand” at auctions around the country. But that petered out sooner than expected, as there was less replacement demand than hoped for. And by November last year, auction prices were beginning to revert to the mean (the sharp drop in the chart above).
That drop bottomed out in March 2018, and prices have been spiking since. The increases in April and May were ascribed to seasonality, but then came June and July. Manheim:
[T]the abnormal summer bounce that started in June continued and strengthened in July. Correspondingly, the best-selling cars at Manheim are worth more today than a month ago, and many vehicles are worth more now than a year ago. Price comparisons to last year will be tougher through the rest of the year; but recent weekly increases were higher than last year, keeping current price performance ahead of last year.
And here’s why: High prices of new vehicles – “affordability challenges,” as Manheim calls it – trigger substitution:
The strange summer price appreciation in used cars is partly a function of a strong economy at its peak, with mounting affordability challenges for the consumer that favor growth in used vehicle sales at the expense of new. These conditions have supported strong used vehicle prices for over a year.
And inflation psychology is setting in with consumers:
The catalyst for even stronger price movement this summer is the fear of import tariffs’ leading to higher prices in the future. Higher prices and the related declining level of supply create a psychological feedback loop for consumers, encouraging buying now with the expectation that prices may be higher later.
The price increases differ by market segment, but according to Manheim, “more affordable vehicles are seeing the greatest increases in values.” Compact cars and midsize cars had the largest price increases, while prices for luxury cars were just barely in the positive.
Year-over-year price changes by major market segment:
- Total: 5.1%
- Compact cars: 5.2%
- Midsize cars: 7.2%
- Luxury cars: 0.2%
- Pickups: 3.3%
- SUV/crossovers: 4.5%
- Vans: 3.4%
In terms of sales at the retail level, by dealers as well as private parties, July was up 3% year-over-year, Manheim said, citing estimates by Cox Automotive, which owns Manheim, Kelley Blue Book, Xtime, and Autotrader.com. It estimates that in July the seasonally adjusted annual rate (SAAR) of sales was 39.2 million vehicles – meaning that at this pace, total used vehicle sales for the 12-month period would be 39.2 million – “the strongest July reading in six years.”
This contrasts with new-vehicle deliveries, which fell 3% in July from a year ago, and were running at a pace of 16.7 million SAAR, according to Manheim’s estimates.
The industry now has to “estimate” monthly new-vehicle deliveries after GM stopped reporting its deliveries in April; GM accounts for over 17% of the new-vehicle market. And as of April, the industry has to fill that hole with estimates. Hence Manheim’s “estimates.”
The new-vehicle market, in terms of the number of deliveries, peaked in 2016 and declined in 2017. The earlier part of this year was slightly stronger, but now the market is losing steam again, as more and more consumers – including many subprime borrowers that are getting locked out of the new vehicle market – switch to used vehicles.
GM, Fiat Chrysler, and Ford all got ugly in unison, in one day, something we haven’t seen since the Financial Crisis. Read… Carmageddon in Detroit