Wolf Richter wolfstreet.com, www.amazon.com/author/wolfrichter
In the jobs report today, the Bureau of Labor Statistics provided a trove of granular data on which industries and governments created jobs over the past 12 months, and which destroyed jobs – with some counter-intuitive results.
I have lumped education jobs at state and local governments into one category to get a better feel for employment in education. I titled this category in my creative manner, “Education, state & local gov,” the fifth largest category, with 10.9 million workers. Employment by state and local governments is then shown “excluding education.”
The Federal government, with a payroll of 2.8 million people, is way down on the list. It may be the largest single employer in the US, but it’s not the largest sector. The military is not included. But it includes the shrinking postal service, which accounts for about 28% of civilian federal employment. The USPS payroll shrank by 10,500 people over the past year.
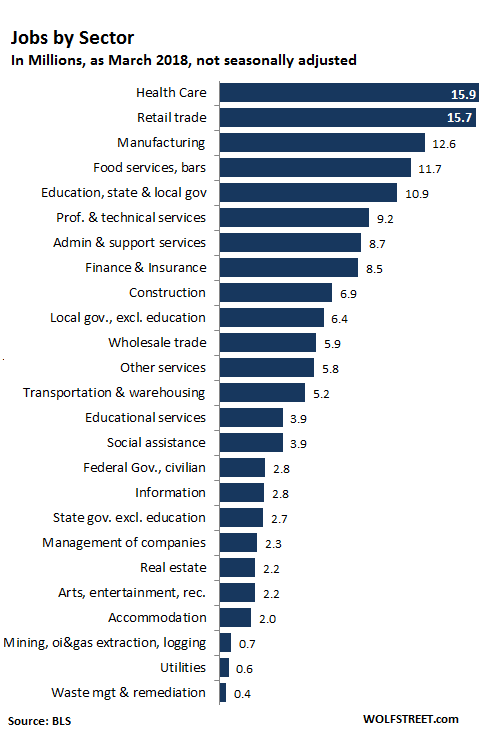
Retail trade, with 15.7 million jobs, is the second largest sector, just behind healthcare, but ahead of manufacturing, which is in third place. So what about Amazon?
Amazon is a big retailer, but it’s also a big tech company with activities that are unrelated to retail, such as its cloud division AWS or its product design shops. It has a gargantuan logistics operation with warehouses around the country. It’s a media company with its own original content. And on and on. So how does its payroll fit into the survey by the Bureau of Labor Statistics, whose results were released today?
The BLS collects the payroll survey data by location. An Amazon “fulfillment center” showing up in the survey would be categorized as “warehousing.” The tech divisions would be located in office parks and categorized as “information services,” and so on. This is the same for Walmart or Macy’s or any of the other retailers that have large online (tech) divisions, warehousing operations, and other entities. Some retailers, such as Walmart or Safeway, have their own fleet of trucks, and the jobs at those locations are classified under trucking.
On the above chart, you can find a category for “management of companies,” which employs 2.3 million people. Bezos would be in that category, as would be lower level managers. So the payroll of a giant company like Amazon gets picked up in the survey by location in bits and pieces and gets spread over numerous categories.
And here’s how these industries and payroll categories have developed their payrolls, either slashing or adding jobs over the past 12 months:
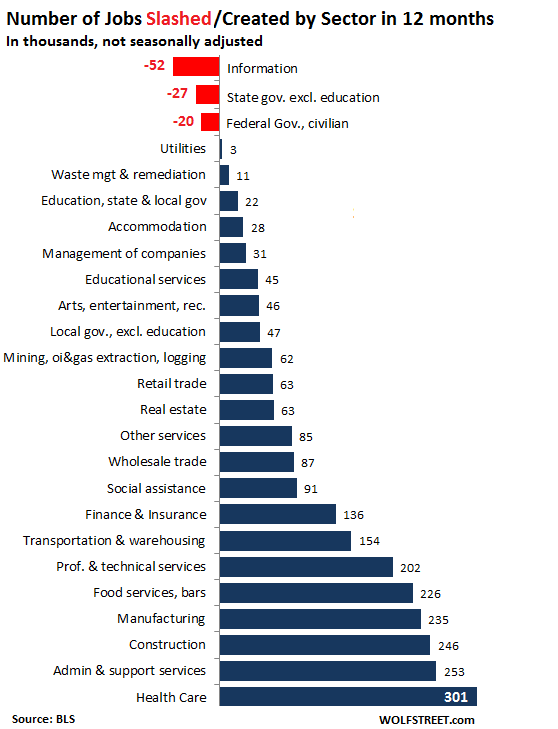
That information technology has been bleeding jobs over the past 12 months might surprise some people. This is a category with 2.8 million workers in March, but that’s down by 52,000 from a year ago. This decline doesn’t go well with the common theme that there are not enough tech workers in the US to fill the jobs.
But many of these tech jobs are at companies that are not tech companies per se. And they routinely outsource their tech jobs to India and other places, or they put them on the chopping block when the cost-cutting gets going. Also, many old-tech companies, such as Microsoft, Cisco, Oracle and many others go through waves and waves of job cuts, especially as they try to extract “efficiencies” out of their flopped acquisitions.
In the chart above, the category, “admin & support services,” with 8.7 million jobs, is comprised of people who keep companies glued together. It created 253,000 jobs over the past 12 months, the second highest tally, after healthcare.
Construction and manufacturing were in third and fourth place, each creating well over 200,000 jobs over the past 12 months.
Even “retail trade” has added 63,000 jobs over the past 12 months. This doesn’t go well with the “brick-and-mortar meltdown.” Or does it?
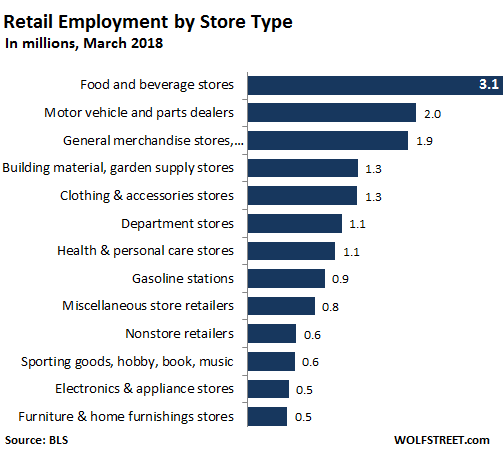
Part of the retail industry is in upheaval and deteriorating rapidly, while the other part (online) is booming. So we need to look at the granular detail by store type (chart below).
The largest store category is “food and beverage stores,” employing 3.1 million people. “Motor vehicle and parts dealers” employ 2.0 million people. Both of those categories are still considered online resistant. “General merchandise stores” (the rest of the label was cut off in the chart) also includes warehouse clubs and supercenters. This is the category where Costco, Walmart, and Sam’s Club are. But remember, these jobs are only the employees at the stores, not the corporate types, tech workers, warehouse workers, and truck drivers.
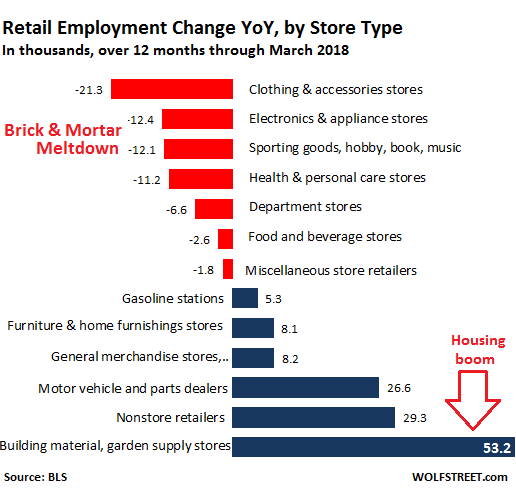
And here is what happened to those jobs over the past 12 months. In the chart below, the brick-and-mortar meltdown sectors are market in red. Over the past 12 months, they’ve shed nearly 70,000 jobs. These are precisely the stores that have been the heroes in my articles about store closings, bankruptcies, and layoffs, including Toys ‘R’ Us, Claire’s, Sears, Bon Ton, Sports Authority, and on and on….
The key part about the unemployment rate the BLS released today is that it’s not an absolute measure of unemployment, was never designed to be that, and shouldn’t be looked at as such. It’s an indicator of trends in the labor market: is it going up or down? As such, it works reasonably well. But it fails as an absolute measure of unemployment – and yet, that’s the primary role it has been shanghaied into by the media coverage of the labor market. So here I’m looking at what’s behind the numbers. Read… The Jobs Report, Sliced and Diced