Wolf Richter wolfstreet.com, www.amazon.com/author/wolfrichter
How the “Yield Curves” Stack Up in central-bank manipulated bond markets.
So we had a little bond-market upheaval this morning. After President Trump successfully manipulated bond yields down yesterday and today by griping about the Fed’s rate hikes, an inveterate Fed dove (who has also been griping about the Fed rate hikes) responded by brushing him off, and suddenly all kinds of things happened, with the 10-year yield jumping and the yield curve steepening a tad within minutes.
St. Louis Fed President James Bullard, for whom every rate hike is a mistake, told reporters this morning in Glasgow, Kentucky, that the FOMC will remain unaffected by Trump’s comments on monetary policy:
“The committee has a mandate to keep inflation low and stable and obtain maximum employment for the U.S. economy, so people can comment, including the president and other politicians, but it’s up to the committee to try to take the best action we can to achieve those objectives.”
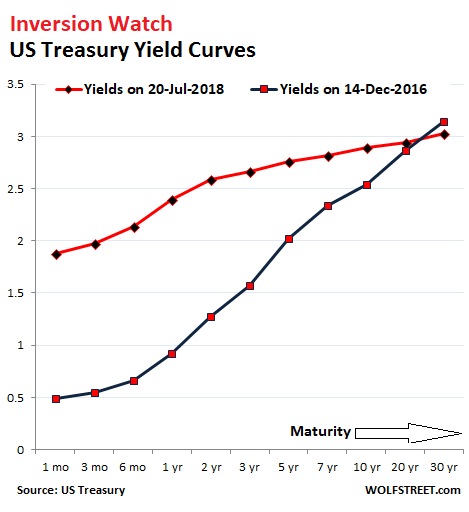
Within moments, the US Treasury 10-year yield rose from 2.85% to 2.89%. With the two-year yield at 2.59%, the “spread” between the two widened to a still minuscule 30 basis points, but that’s up from 24 basis points on July 17, which had been the narrowest spread since before the Financial Crisis.
There is now a consensus that the yield curve must invert — that the two-year yield will rise above the 10-year yield — and that this yield-curve inversion is necessarily a predictor of a coming recession, and some think it will even cause a recession. But markets have a way of blowing this type of consensus out of the water.
The chart below shows the yield curves on December 14, 2016, when the Fed got serious about raising rates (black line) and this morning (red line). Note how the red line has “flattened” compared to the black line. The 30-basis points spread between the two-year and the 10-year markers this morning is minuscule compared to the 127-basis point spread on December 14, 2016:
How does this compare to the government bond “markets” in other major economies – particularly in Japan, Germany, and China?
First things first: “Market” in quotes because there really is no market in the sense that real price discovery is taking place, in the era of zero-interest-rate policies, negative-interest-rate policies, QE, stealth QE (China), and QQE (Japan).
For instance, in the Japanese government bond market, the second largest in the world, the amount of bonds outstanding has ballooned. But a large portion is held by the Bank of Japan and government-controlled entities, such as the Post Bank and the Government Pension and Investment Fund, and there are days when not a single 10-year JGB is traded. This “market” has been purposefully put to death by the BOJ.
The BOJ’s short-term interest-rate target is a negative -0.1%. In September 2016, in terms of its QQE bond-buying program, it introduced “Yield Curve Control” – a policy that targets yields along the entire yield curve, and not just short-term yields. This is something no other central bank has tried before. The stated purpose is to keep the 10-year yield near and above 0%. This policy now has some peculiar effects [Bank of Japan Takes Away Punch Bowl, Balance Sheet Declines].
The ECB first ventured into negative interest rate policy (NIRP) in June 2014 and then pushed deeper into it. Since March 2016, its “deposit facility” rate has been a negative -0.4%. It also embarked on an ambitious QE program. As a result, even for countries in iffy fiscal condition, such as Italy, short-term yields fell into the negative; and German yields are negative a good way up the yield curve. These phenomena would be totally inexplicable in normal times.
By comparison, China’s government bond market is relatively sanguine, with higher yields, while the government has it hands full – via its state-owned and state-supported megabanks – keeping the corporate bond market from imploding unceremoniously.
So here are the yield curves of the US, Japan, Germany, and China, reflecting yields as of this morning:
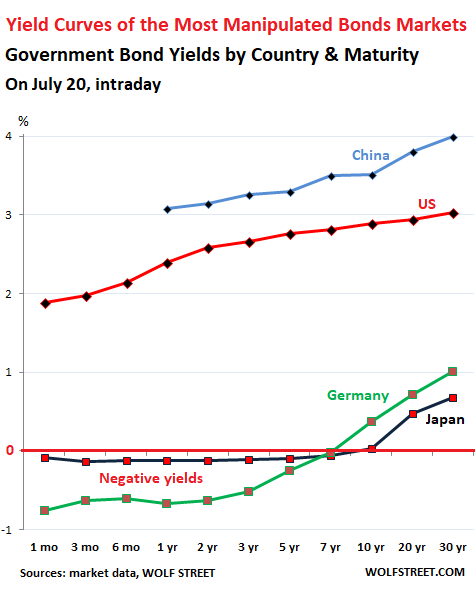
By comparison, the US yield curve doesn’t look so flat anymore.
Japan’s yield curve is essentially flat from the one-month yield through the 10-year yield — a spread of 5 basis points, compared to the US spread of 101 basis points. The BOJ has proven that a central bank can engineer a flat yield curve purposefully without allowing it to invert. Now every central bank has learned from this experiment and knows how to do it.
Japan has had the benefit of more or less real price stability over the past two decades, so inflation-adjusted yields are not in the deepest punishment basement. That cannot be said for German yields.
Germany’s yield curve is the most negative among Eurozone countries. Yet, Germany’s consumer price inflation in June was 2.1%. Yields adjusted for inflation are deeply negative all the way up the yield curve to 30 years. No rational investor would subject themselves to this punishment. But there is forced buying by pension funds, life insurance companies (part of the private-sector pension system), bond funds, and other entities that have to buyGerman government bonds no matter what. They – or rather their beneficiaries whose money this is – are “gradually” bleeding, every day until maturity.