US National Debt Spiked by $1 trillion in 5 weeks to $26 trillion. Fed monetized 65%. Business debts spike to high heaven.
By Wolf Richter for WOLF STREET.
Trillions are now whooshing by at a breath-taking pace. The US gross national debt – the total of all Treasury securities outstanding – jumped by $1 trillion over the past five weeks
The total US national debt outstanding has reached $26 trillion, according to the Treasury Department. I’ve been fretting about this debt on my site since 2011. In recent years, I innocently added a green upward arrow with “Debt out the wazoo” to my gross-national-debt charts, unaware that this tongue-in-cheek label would turn into a factual, data-based technical term:
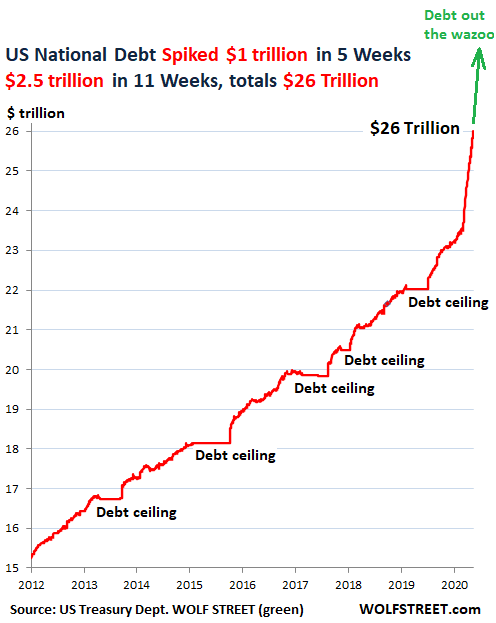
And think about this: The huge mountain of debt that took decades to grow to this gargantuan size has exploded by another 10% in just 11 weeks.
The curious flat spots in the chart are the periods when the national debt bounced into the Congress-imposed debt ceiling. During these periods, the government borrowed from federal pension funds and other internal sources – the “extraordinary measures” – to make ends meet, thereby continuing to borrow, and when the political charade was resolved and the debt ceiling was raised, bam, the debt jumped by hundreds of billions in weeks. Now the debt jumps by the trillions in weeks on a routine basis.
On February 19, when the debt had soared by $1.3 trillion in 12 months to $23.3 trillion, I mused: “But these are the good times. And we don’t even want to know what this will look like during the next economic downturn.”
Turns out, we didn’t get a regular economic downturn. We got the most epic and sudden economic downturn ever. And now we’re beginning to know what this looks like in terms of the US debt.
Fed monetizes 65% of the additional debt.
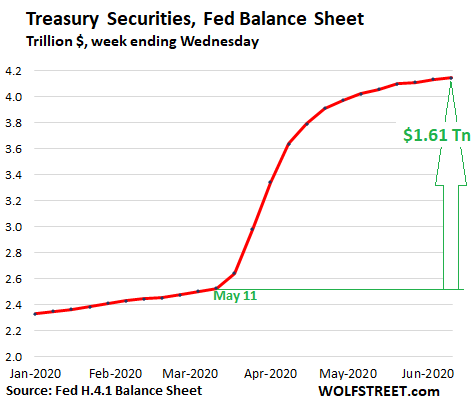
From early March through its balance sheet released yesterday, the Fed added $1.61 trillion in Treasury securities to its assets as part of its Everything Bubble bailout program. Over the same period, the US debt soared by an additional $2.5 trillion. The Fed has thereby indirectly – as is the rule in the US – monetized 65% of this additional debt.
But as you can see in the chart below, the Fed’s monetization of the US debt has slowed to a trickle in recent weeks, after the original shock-and-awe spree in March and April. In the week through Wednesday, the Fed has added merely $8.8 billion in Treasury securities, the small weekly total all year:
And then there is this: Business debts are skyrocketing.
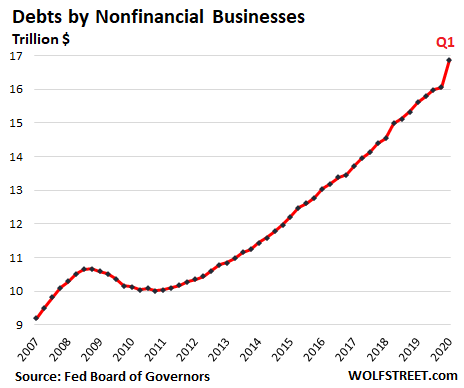
Business debts already skyrocketed in the first quarter, according to data released yesterday by the Fed’s Board of Governors. In Q1, total “nonfinancial” business debts, which include corporations and other businesses but not financial intermediaries such as banks (that borrow to lend, and including them would result in double-counting a lot of debts), jumped to $16.86 trillion.
This was a 5% increase from the prior quarter, the largest such quarter-to-quarter increase in the data going back to the 1950s:
And for business debts, the second quarter is going to be a doozie. Businesses have sold enormous piles of investment-grade bonds and junk bonds in April and May. And this pace appears to be continuing in June. The Fed’s Board of Governors will report total business debts for Q2 in three months.
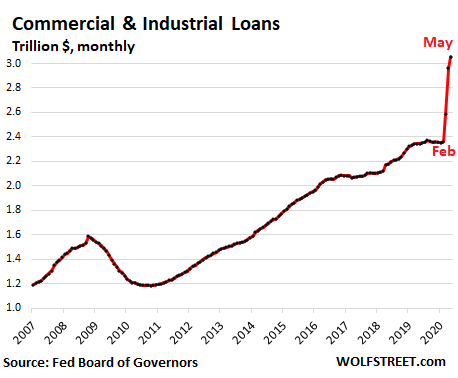
But we already know from the weekly banking report by the Fed Board of Governors that “commercial and industrial loans,” which are part of the nonfinancial business debts, have spiked by a stunning 29% in three months, by far the most ever, from $2.36 trillion at the end of February – and the end of the Good Times – to $3.05 trillion at the end of May (on a weekly basis, they have started to tick down since their weekly peak of $3.09 trillion in mid-May):
Households gorged less on debt. Municipal debt remains flat. But now everything has changed.
Household debts – mortgages, HELOCs, credit cards, auto loans, student loans, and other loans – rose to $16.3 trillion in Q1, another record, and up 12.4% from the peak at the early innings of the Financial Crisis in Q3 2008. Given population growth over the 12 years and inflation, in aggregate households were less vulnerable – until 30 million people lost their jobs over the past two months.
And with households, it’s not the “aggregate” debt that matters, but the debts of the most vulnerable 20% or 30%, which is where households are loaded up with debts, and this includes subprime auto loans and subprime credit card loans – and the mess has started to blow up even before the pandemic and before the 30 million job losses.
Debt by states and municipal governments, at $3.1 trillion in Q1, has remained relatively flat since the Financial Crisis, after having peaked at $3.2 trillion in Q4 2010. But states and cities now have a revenue problem of a stunning suddenness and depth.
$60 trillion in nonfinancial debts…
In Q1, total nonfinancial debt, including government debt at all levels, nonfinancial business debts, and household debts jumped to $55.9 trillion, according to the Fed Board of Governors.
And Q2 will likely add $3+ trillion in Treasury debt, plus the large amounts of business debts issued in April, May and June. All combined, total nonfinancial debts will approach $60 trillion by the end of June – having doubled in the 14 years since 2006. Debt out the wazoo.