Wolf Richter wolfstreet.com, www.amazon.com/author/wolfrichter
The US Treasury yield curve is having some bad-hair days. It is overall flat-ish, but within this description, it is steepening at the short end, sagging in the middle, and steepening at the long end. And all of it, from the one-month yield on up, is above the rate of inflation as measured by CPI, something we haven’t seen in that magnitude since the brief deflation scare in 2009.
On January 15, this is where the Treasury yields across the curve ended up. Note how they are nearly the same in the middle of the yield curve — from six months through five years, with the three-year yield marking the low point:
- 1-month yield: 2.41%
- 3-month yield: 2.43%
- 6-month yield: 2.52%
- 1-year yield: 2.57%
- 2-year yield: 2.53%
- 3-year yield: 2.51%
- 5-year yield: 2.53%
- 7-year yield: 2.61%
- 10-year yield: 2.72%
- 20-year yield: 2.92%
- 30-year yield: 3.08%
The chart below shows the yield curves for these four days:
- January 15, 2019 (red line);
- January 3, 2019 (blue line);
- November 2, 2018 (yellow line);
- December 14, 2016, when the Fed got serious about raising rates (green line).
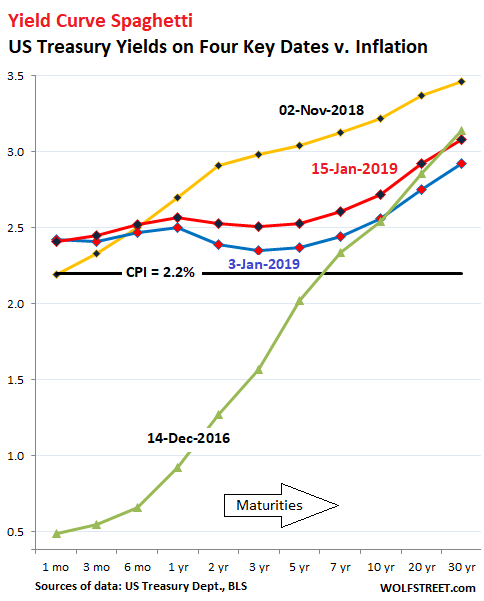
The blue line (yields on January 3) sagged heavily – a sign that the yield curve was “inverted” in the middle between the one-year yield and the seven-year yield. This inversion in the middle has lessened somewhat by now (red line), and the line is sagging less, as the longer end of the yield curve has risen.
And note how the yield curve looked before the Fed got serious about raising short-term rates (green line) — not much has happened at the long end since December 14, 2016, even as the short end was pushed up by the Fed:
The spread between the 2-year yield and the 10-year yield, currently at 19 basis points, is very narrow, but it has been in this 18 to 25 basis point range since August 2018, and it has not yet inverted (where the two-year yield would be higher than the 10-year yield).
The black horizontal line in the chart above denotes the annual rate of inflation in December, as measured by CPI (2.2%). With the one-month yield at 2.41%, it is 21 basis points higher than CPI, something we have not seen since the deflation scare in 2009.
The chart below shows the one-month yield (black line) and the annual rate of inflation as measured by CPI (red line) going back to 2000. There were only five periods over those 18 years when the one-month Treasury yield was above the rate of inflation. For the rest of the time, the “real” yield was negative, a situation when investors don’t even earn enough of a return to make up for the loss of purchasing power brought to you by inflation.
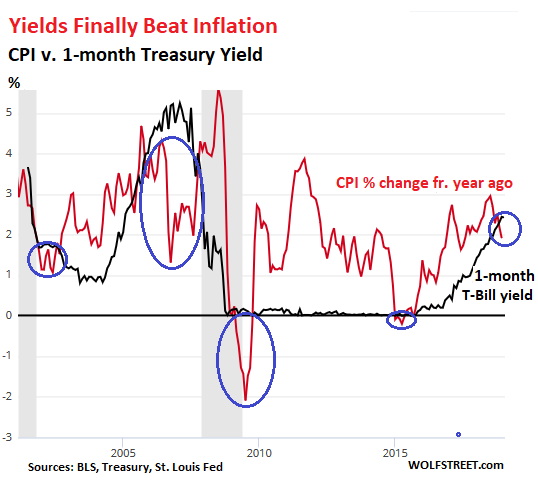
The Fed can manipulate short-term yields with reasonable consistency. So when it pushes them down below the rate of inflation, it’s not an accident. It’s punishment for everyone that has money invested in short-term low-risk instruments, from T-bills to savings products. And as the chart above shows, this form of punishment has been the “normal” condition over the past two decades.
There have only been five fairly brief exceptions. One of those exceptions was in 2016 during the oil bust, when energy prices plunged. During that period, CPI growth dipped into the negative (deflation), but only very briefly, and only a tiny bit, just enough to put it below the one-month yield which was near zero due to the Fed’s zero-interest-rate policy.
The current positive “real” one-month yield of 21 basis points is more significant. And this is one reason why the Fed might want to be “patient” with raising short-term rates further if it wants to keep monetary policy near “neutral.” If short-term yields end up significantly above the rate of inflation, it has a tightening effect on financial conditions.
But for investors in low-risk assets, such as short-term Treasuries, money markets, and savings products, this is one of the few periods in two decades when inflation doesn’t eat their lunch.