- Review & Update
- No Risk Of Recession
- Sector & Market Analysis
- 401k Plan Manager
Follow Us On: Twitter, Facebook, Linked-In, Sound Cloud, Seeking Alpha
Review
I have been traveling a lot the last couple of weeks, so a big “Thank You” goes to Michael Lebowitz for “pinch hitting” for me. This week, I just want to review a couple of things as we begin to wrap up 2017.
Earlier this week, I wrote a piece called “This Is Nuts.” If you haven’t got a chance to read it, I suggest you do. It outlines my view on the current market extension in the short-term and the potential for a mean-reverting correction at some point in the future. To wit:
“More importantly, a decline of such magnitude will threaten to trigger ‘margin calls’ which, as discussed previously, is the ‘time bomb’ waiting to happen.
Here is the point. The ‘excuses’ driving the rally are just that. The election of President Trump has had no material effect on the market outside of the liquidity injections which have exceeded $2 Trillion.
Importantly, on a weekly basis, the market has pushed into the highest level of overbought conditions on record since 2005. I have marked on the chart below each previous peak above 80 which has correlated to a subsequent decline in the near future.”
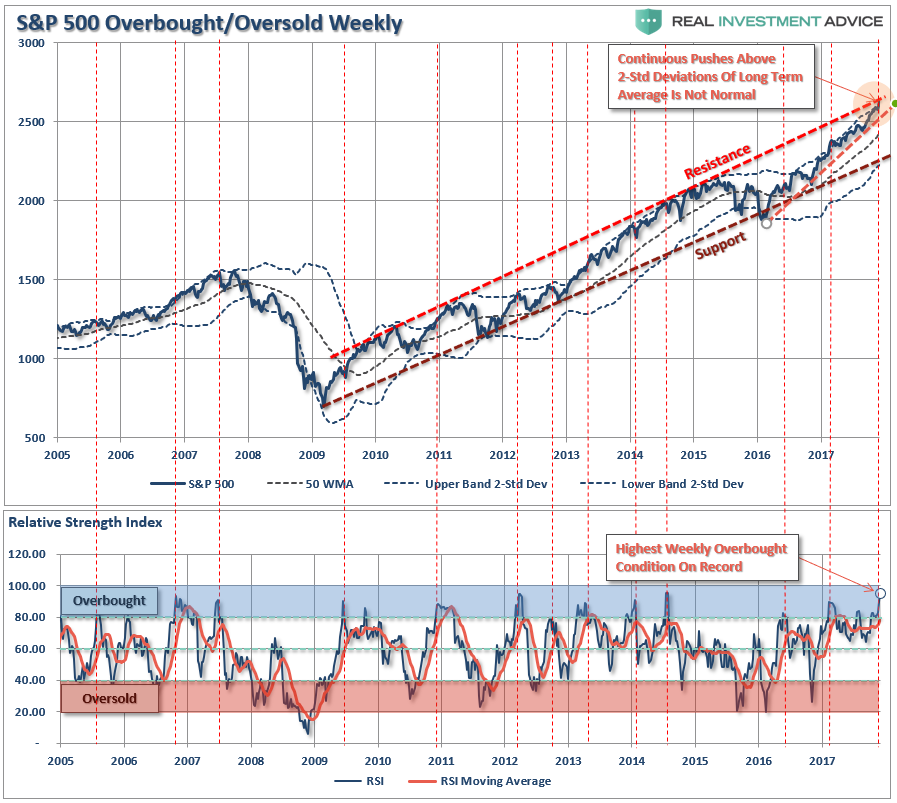
As I noted, the problem for investors is not being able to tell whether the next correction will be just a “correction” within an ongoing bull market advance, or something materially worse. Unfortunately, by the time most investors figure it out – it is generally far too late to do anything meaningful about it.
“As shown below, price deviations from the 50-week moving average has been important markers for the sustainability of an advance historically. Prices can only deviate so far from their underlying moving average before a reversion will eventually occur. (You can’t have an ‘average’ unless price trades above and below the average during a given time frame.)”
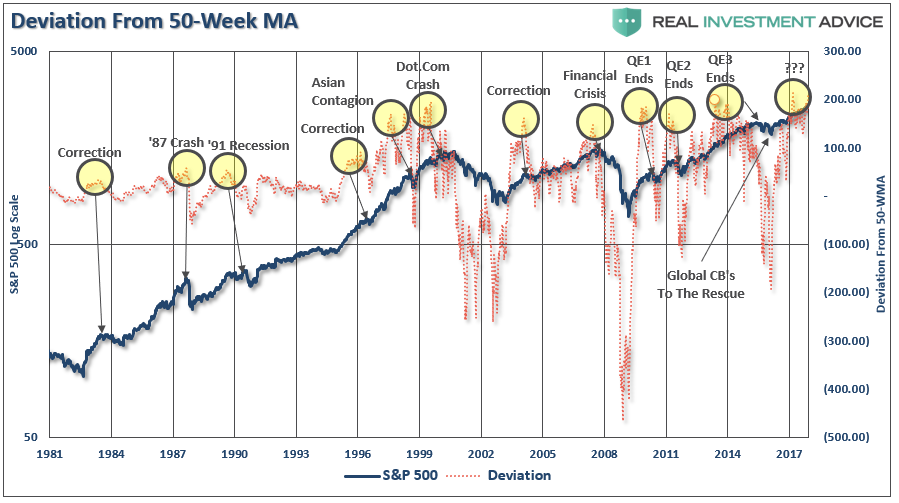
“Notice that price deviations became much more augmented heading into 2000 as electronic trading came online and Wall Street turned the markets into a ‘casino’ for Main Street. At each major deviation of price from the 50-week moving average, there has either been a significant correction, or something materially worse.”
However, in the short-term, the market trends are CLEARLY bullish, very overbought, but nonetheless bullish.

As such, our portfolios remain “long” on the equity side of the ledger…for now.
I am still somewhat suspicious of the markets going into 2018. As I laid out over the last couple of weeks, I believe the risk of “tax-related” selling is a strong possibility at the beginning of the year as portfolios lock in gains without having to pay taxes until 2019. While the risk to the overall market trend remains small, a correction of 3-5% is possible. I am still looking for the right “setup” by the end of the month to add a small “short S&P 500” position to portfolios and increase longer-duration bond exposure to hedge off some of the potential risks. I will keep you apprised.
Importantly, while the short-term backdrop is clearly bullish, and as noted above, the longer-term overbought condition remains worrisome. The monthly chart below shows the current market extension is at levels rarely seen in market history. With the market trading into 3-standard deviations above the 3-year moving average, RSI pushing well above 70, and the MACD line hitting the highest level since 2000, the risk of a market reversion has risen.

While there is plenty of discussion of the support of Central Banks keeping markets afloat indefinitely into the future, it should be remembered that at the peak of every major market throughout history, it was always believed to be “different this time.”
But in the end, it wasn’t, and this time is unlikely to be different as well.
No Risk Of A Recession?
I have discussed, along with Doug Kass, several different “meme’s” running around as of late trying to justify the current market extension. To wit:
“The advance has had two main storylines to support the bullish narrative.
- It’s an earnings recovery story, and;
- It’s all about tax cuts.”
We can add to that list “economic growth” given the strength of the rebound over the last two-quarters which followed two quarters of exceptionally weak growth in Q4 of 2016 and Q1 of 2017. While the growth has certainly gotten everyone excited as of late, it is quite possible we have seen the peak of the “restocking cycle” for now.
Under the guise of these “meme’s” it is currently believed that a “recession” is nowhere to be found and therefore it should be “clear sailing” for investors as we head into 2018 and beyond.
But, is that necessarily the case?
A Funny Thing Happened On The Way To The Recession
The majority of the analysis of economic data is short-term focused with prognostications based on single data points. For example, let’s take a look at the data below of real economic growth rates:
- January 1980: 1.43%
- July 1981: 4.39%
- July 1990: 1.73%
- March 2001: 2.30%
- December 2007: 1.87%
Each of the dates above shows the growth rate of the economy immediately prior to the onset of a recession.
You will remember that during the entirety of 2007, the majority of the media, analyst, and economic community were proclaiming continued economic growth into the foreseeable future as there was “no sign of recession.”
I myself was rather brutally chastised in December of 2007 when I wrote that:
“We are now either in, or about to be in, the worst recession since the ‘Great Depression.’”
Of course, a full year later, after the annual data revisions had been released by the Bureau of Economic Analysis was the recession officially revealed. Unfortunately, by then it was far too late to matter.
However, it is here the mainstream media should have learned their lesson.
The chart below shows the S&P 500 index with recessions and when the National Bureau of Economic Research dated the start of the recession.
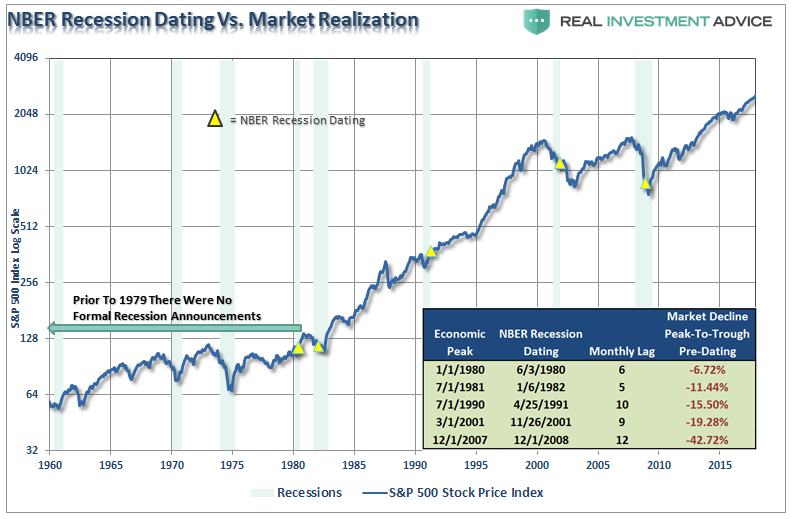
There are three lessons that should be learned from this:
- The economic “number” reported today will not be the same when it is revised in the future.
- The trend and deviation of the data are far more important than the number itself.
- “Record” highs and lows are records for a reason as they denote historical turning points in the data.
For example, the level of jobless claims is one data series currently being touted as a clear example of why there is “no recession” in sight. As shown below, there is little argument that the data currently appears extremely “bullish” for the economy.

However, if we step back to a longer picture we find that such levels of jobless claims have historically noted the peak of economic growth and warned of a pending recession.

This makes complete sense as “jobless claims” fall to low levels when companies “hoard existing labor” to meet current levels of demand. In other words, companies reach a point of efficiency where they are no longer terminating individuals to align production to aggregate demand. Therefore, jobless claims naturally fall.
But there is more to this story.
Less Than Meets The Eye
The last two-quarters of economic growth have stronger than the last two, but not breaking any records by any measure. However, these two stronger quarters of growth come at a time when oil prices are recovering modestly from their crash boosting activity and earnings.
Furthermore, this widely touted economic and earnings “recovery,” as witnessed by surging asset prices, should have certainly been met by stronger activity from the majority of Americans, right?
What’s going on here?
Economic cycles are only sustainable for as long as excesses are being built. The natural law of reversions, while they can be suspended by artificial interventions, cannot be repealed.
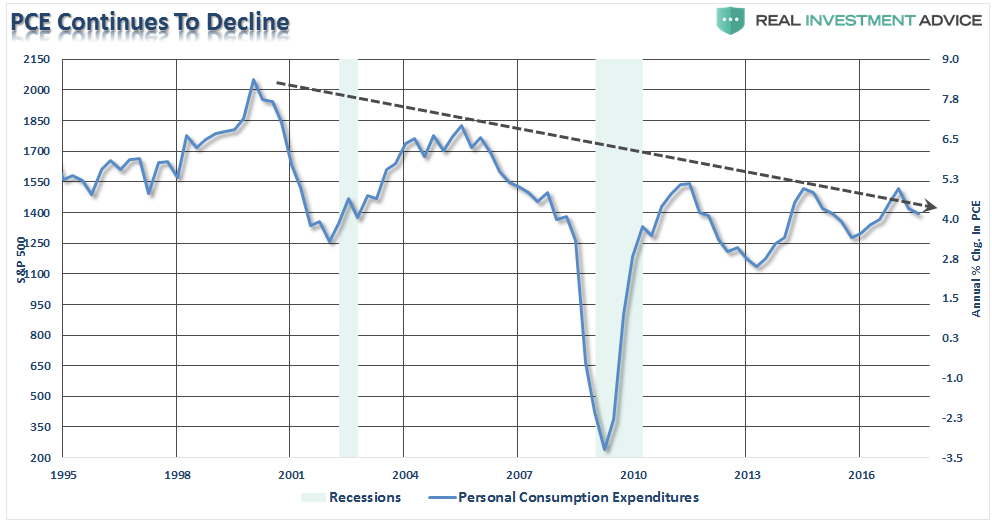
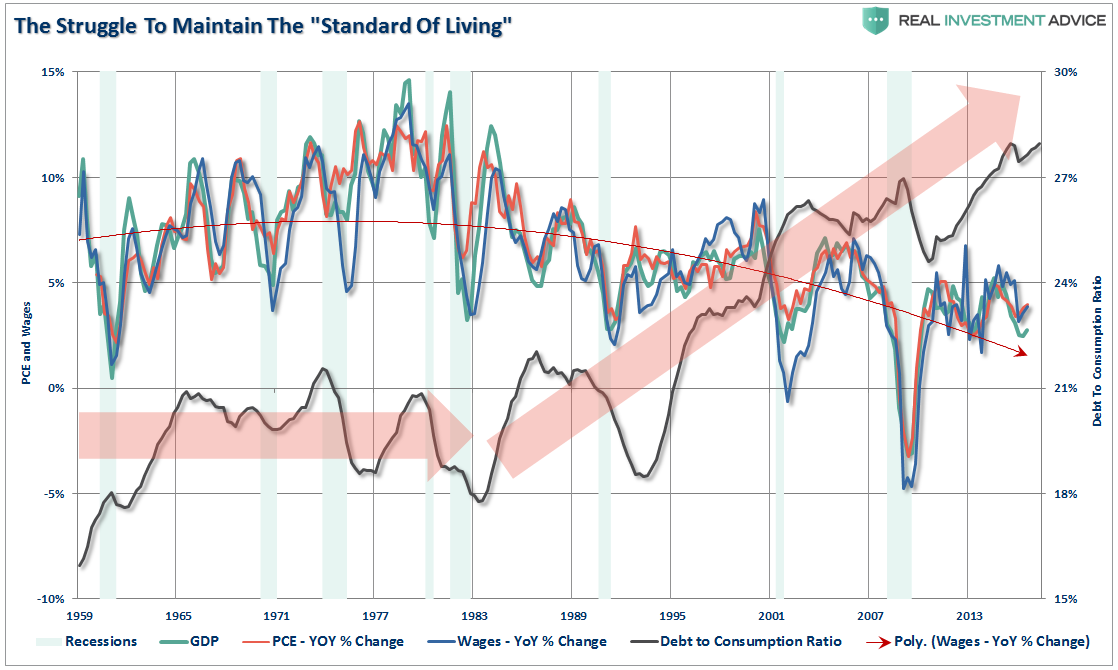
More importantly, while there is currently “no sign of recession,” what is going on with the main driver of economic growth – the consumer?
The chart below shows the real problem. Since the financial crisis, the average American has not seen much of a recovery. Wages have remained stagnant, real employment has been subdued and the actual cost of living (when accounting for insurance, college, and taxes) has risen rather sharply. The net effect has been a struggle to maintain the current standard of living which can be seen by the surge in credit as a percentage of the economy.
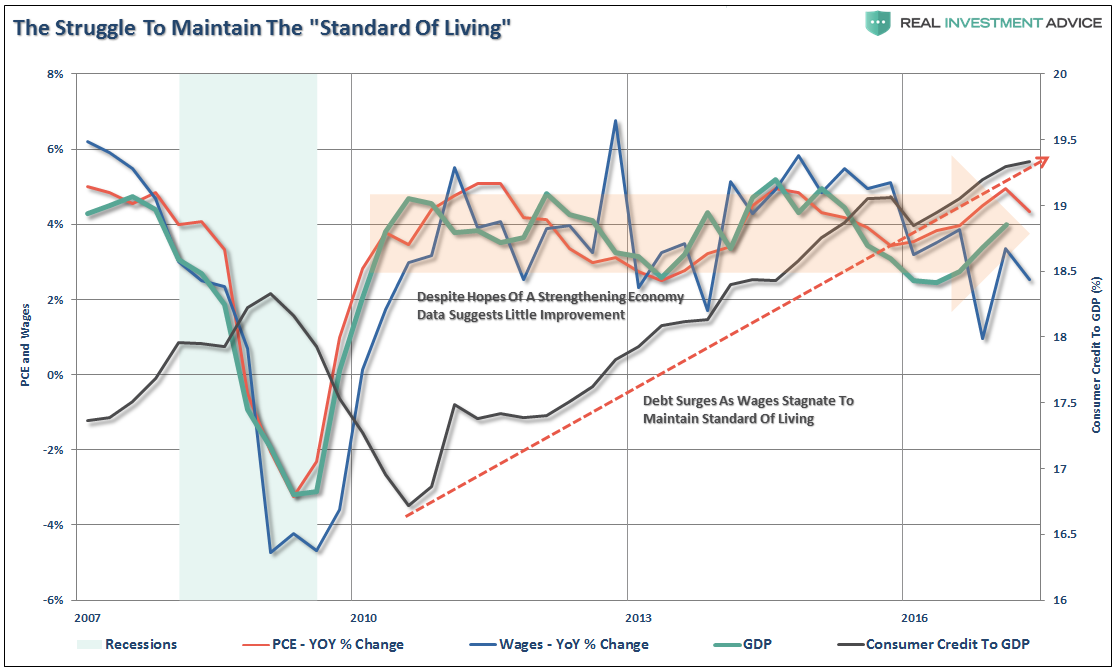
To put this into perspective, we can look back throughout history and see that substantial increases in consumer debt to GDP have occurred coincident with recessionary drags in the economy. No sign of recession? Are you sure about that?
There has been a shift caused by the financial crisis, aging demographics, massive monetary interventions and the structural change in employment which has skewed the seasonal-adjustments in economic data. This makes every report from employment, retail sales, and manufacturing appear more robust than they would be otherwise. This is a problem mainstream analysis continues to overlook but will be used as an excuse when it reverses.
Here is my point. While the call of a “recession” may seem far-fetched based on today’s economic data points, no one was calling for a recession in early 2000 or 2007 either. By the time the data is adjusted, and the eventual recession is revealed, it won’t matter as the damage will have already been done.
As Howard Marks once quipped:
“Being right, but early in the call, is the same as being wrong.”
While being optimistic about the economy and the markets currently is far more entertaining than doom and gloom, it is the honest assessment of the data and the underlying trends that are useful in protecting one’s wealth longer term.
Is there a recession currently? No.
Will there be a recession in the not so distant future? Absolutely.
Whether it is a mild, or “massive,” recession will make little difference to individuals as the net destruction of personal wealth will be just as damaging. Such is the nature of recessions on the financial markets.
Of course, I am sure to be chastised for penning such thoughts just as I was in 2000 and again in 2007. That is the cost of heresy against the financial establishment, unexperienced investors consumed by complacent optimism and emotionally-driven willful blindness. I am okay with that, it is a price I will gladly pay to keep my clients, and loyal readers, from being burned at the stake, not if, but when the next recession begins.
See you next week.
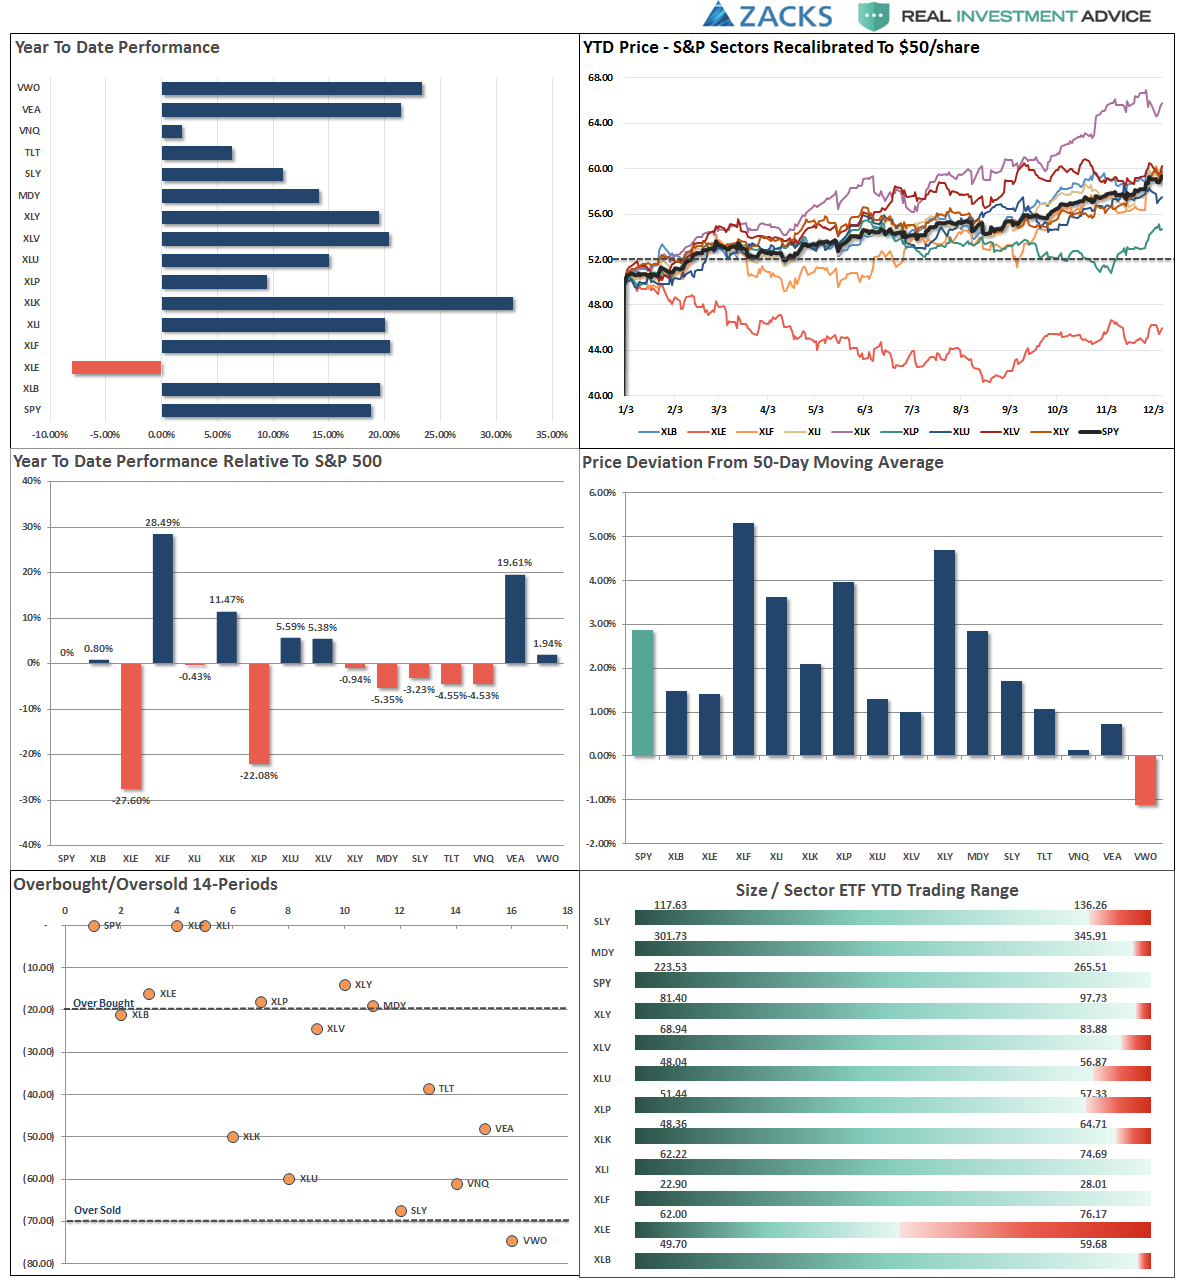
Market & Sector Analysis
Data Analysis Of The Market & Sectors For Traders
S&P 500 Tear Sheet
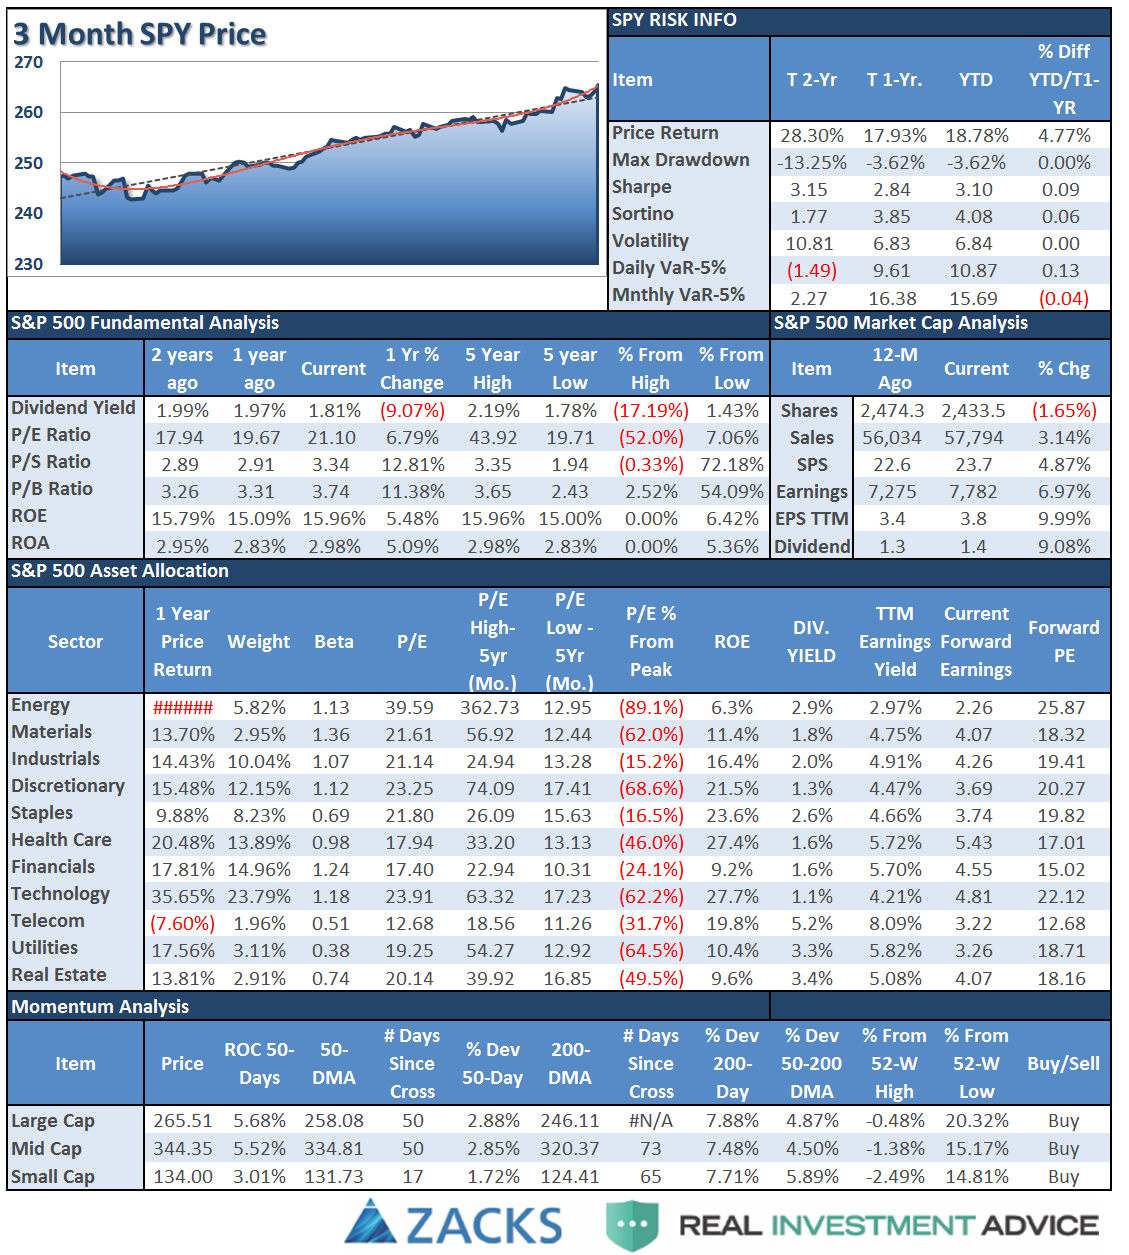
Performance Analysis
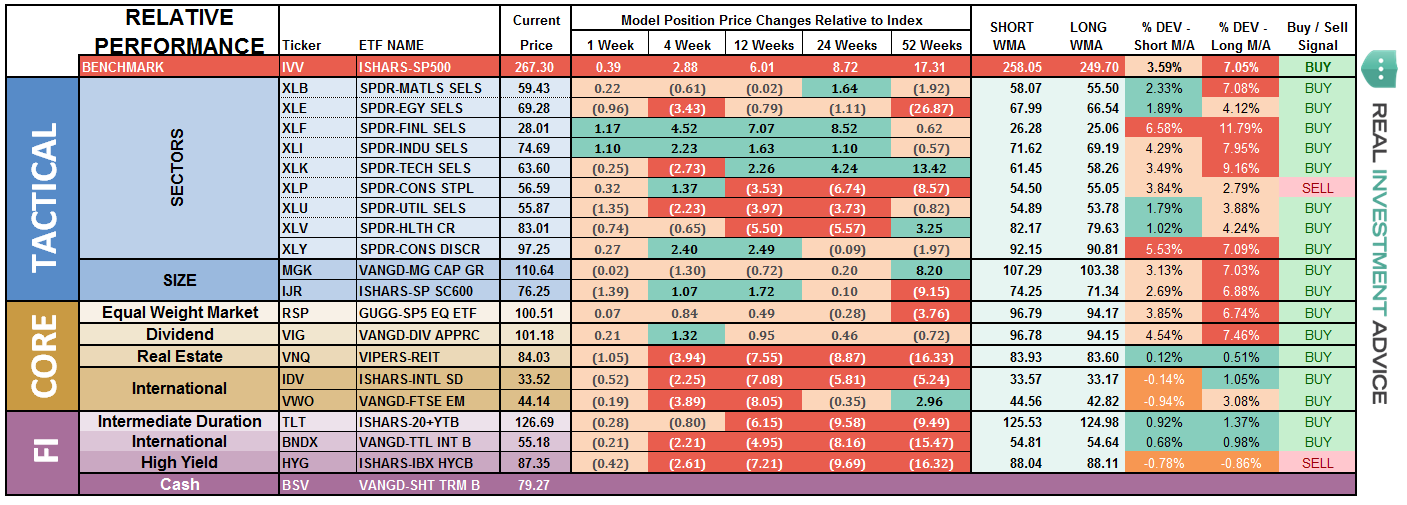
ETF Model Relative Performance Analysis
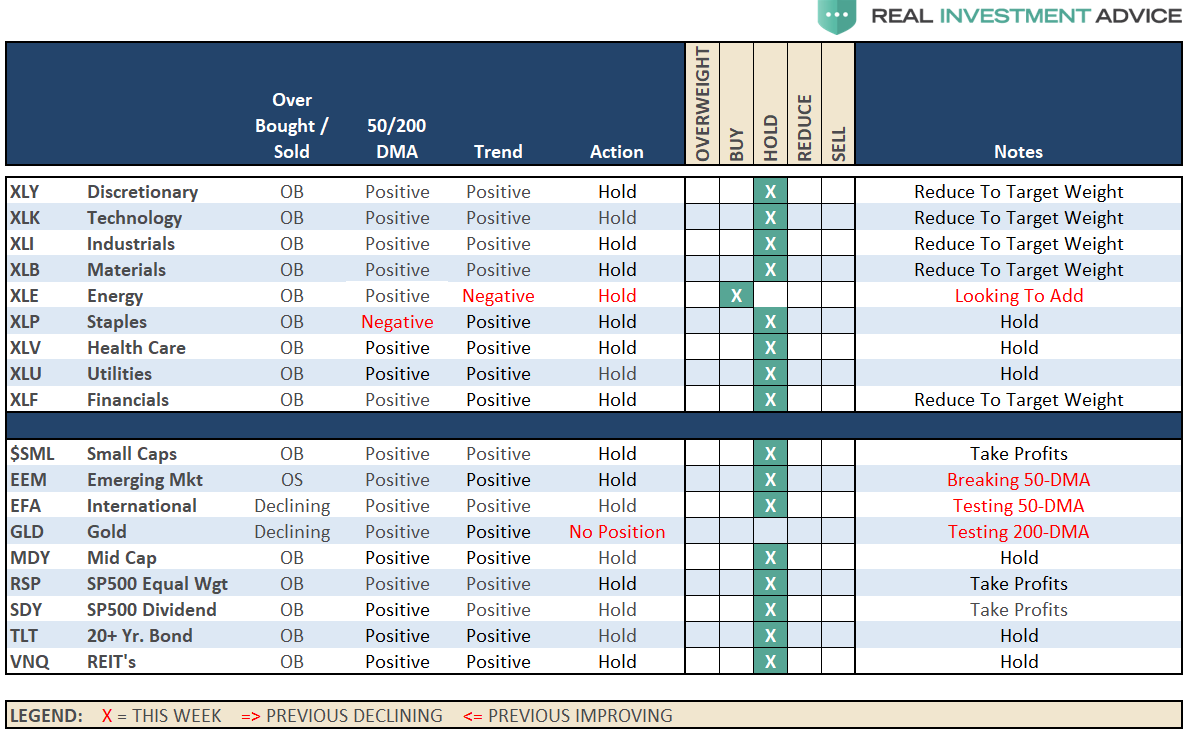
Sector & Market Analysis:
Did Santa come early?
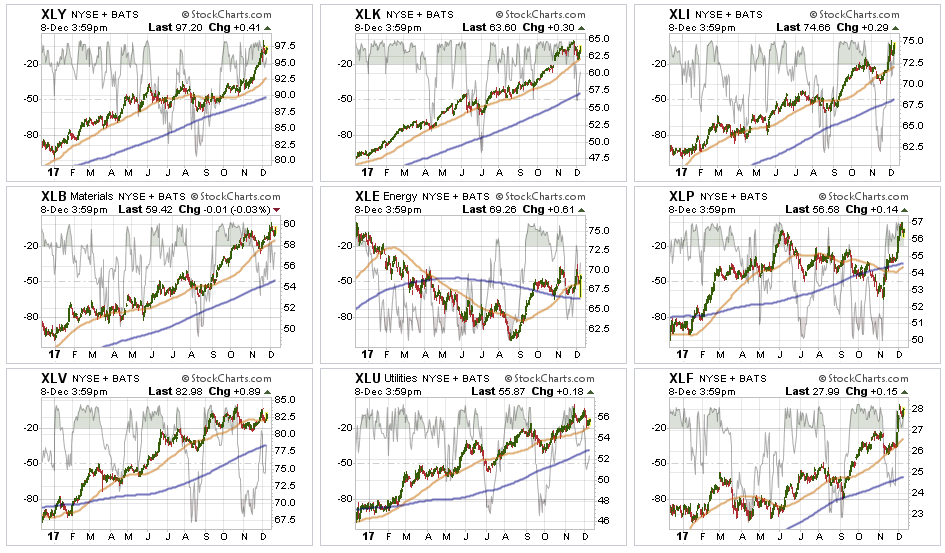
Technology has lagged over the past few weeks, but remains near highs. It appears Technology may have begun a consolidation or topping process. We will need to wait to see how the current price action resolves itself before taking action within the sector.
Healthcare as I noted previously, the sector had slipped below its 50-day moving average, however, the “buy everything” mode of the market over the last week resolved that situation keeping health care on hold in portfolios for now. Move stops up to the 50-dma for now.
Energy – as I noted previously, the energy sector had gotten trapped between the 50 and 200-dma. The positive backdrop, however, was the 50-dma having crossed above the 200-dma. I have noted over the last couple of weeks we were looking for a tactical trading entry point. We achieved that this week with the bounce of the 50-dma. We are adding one-half of a tactical trading position to portfolios next week.
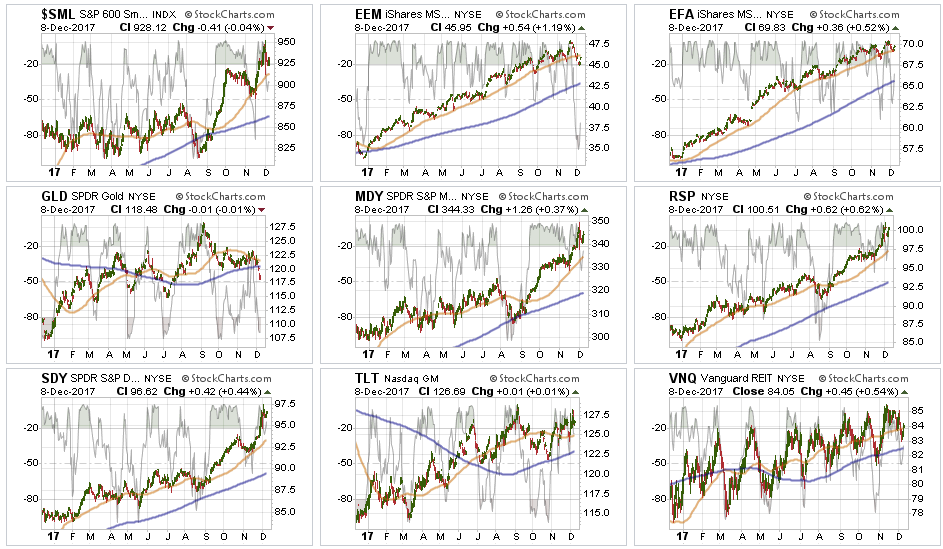
Small and Mid-Cap stocks along with the broader index struggled earlier this week on tax-reform concerns but rebounded at the end of the week. Trends are positive which keeps allocations on hold but are too grossly extended currently to add positions. Look for a correction to support to add weighting.
Emerging Markets and International Stocks have shown some weakness as of late in terms of momentum, but remain in a bullish trend overall. We remain long these markets for now but have moved up stops accordingly.
S&P Equal Weight & Dividend Stocks – In our “core portfolios” we carry an equal weighting of both the S&P 500 dividend index and the S&P 500 equal-weight index. This balance gives us historically better performance, lower volatility and a higher yield than just carrying the S&P 500 index. However, both of these positions have simply gone parabolic as money is chasing yield currently. We are taking profits and rebalancing accordingly.
Bonds and REIT’s – With“tax reform” being passed by the Senate, rates did tick up last week slightly. However, given the makeup of the tax bill, the realization that this current iteration will not create surging inflation, growth and interest rates is becoming more apparent. The bullish trend in Bonds and REIT’s continues so we will continue looking for pullbacks to add additional exposure.
Sector Recommendations:
(These are not recommendations or solicitations to take any action. This is for informational purposes only related to market extremes and contrarian positioning within portfolios. Use at your own risk and peril.)
Portfolio Update:
The market continued to hold its bullish trend this past week despite a pickup in volatility. This type of market is extremely dangerous as when markets break, and then immediately rebound, it lulls investors into a high degree of complacency that stocks “simply can’t go down.” While we are in the seasonally strong period of the year, we remain cognizant of the underlying risk.
Furthermore, as noted above, I stated the following at the beginning of November:
“I am now looking to begin building ‘Short S&P 500 and Nasdaq’ positions into portfolios over the next few weeks as a hedge against a January decline as noted above. I will keep you advised as to changes in portfolios ahead if my expectations begin to come to fruition.”
I am looking for the right “set up” to implement that trade.
As noted, we are also adding 1/2 of a tactical trading position in Energy after an improvement in performance and recent bullish change in the technical underpinnings.
As the Senate and House tax bills enter “conference,” I think we will get a much better picture of the likelihood of passage and what it will actually look like. There is a rather high degree of risk that stocks will sell-off following any passage of a “tax reform” bill as much of the benefit has already been priced into the market. In other words, there is a much higher probability of “disappointment” rather than “surprise” at this juncture.
As always, we remain invested but are becoming highly concerned about the underlying risk. Our main goal remains capital preservation.
THE REAL 401k PLAN MANAGER
The Real 401k Plan Manager – A Conservative Strategy For Long-Term Investors
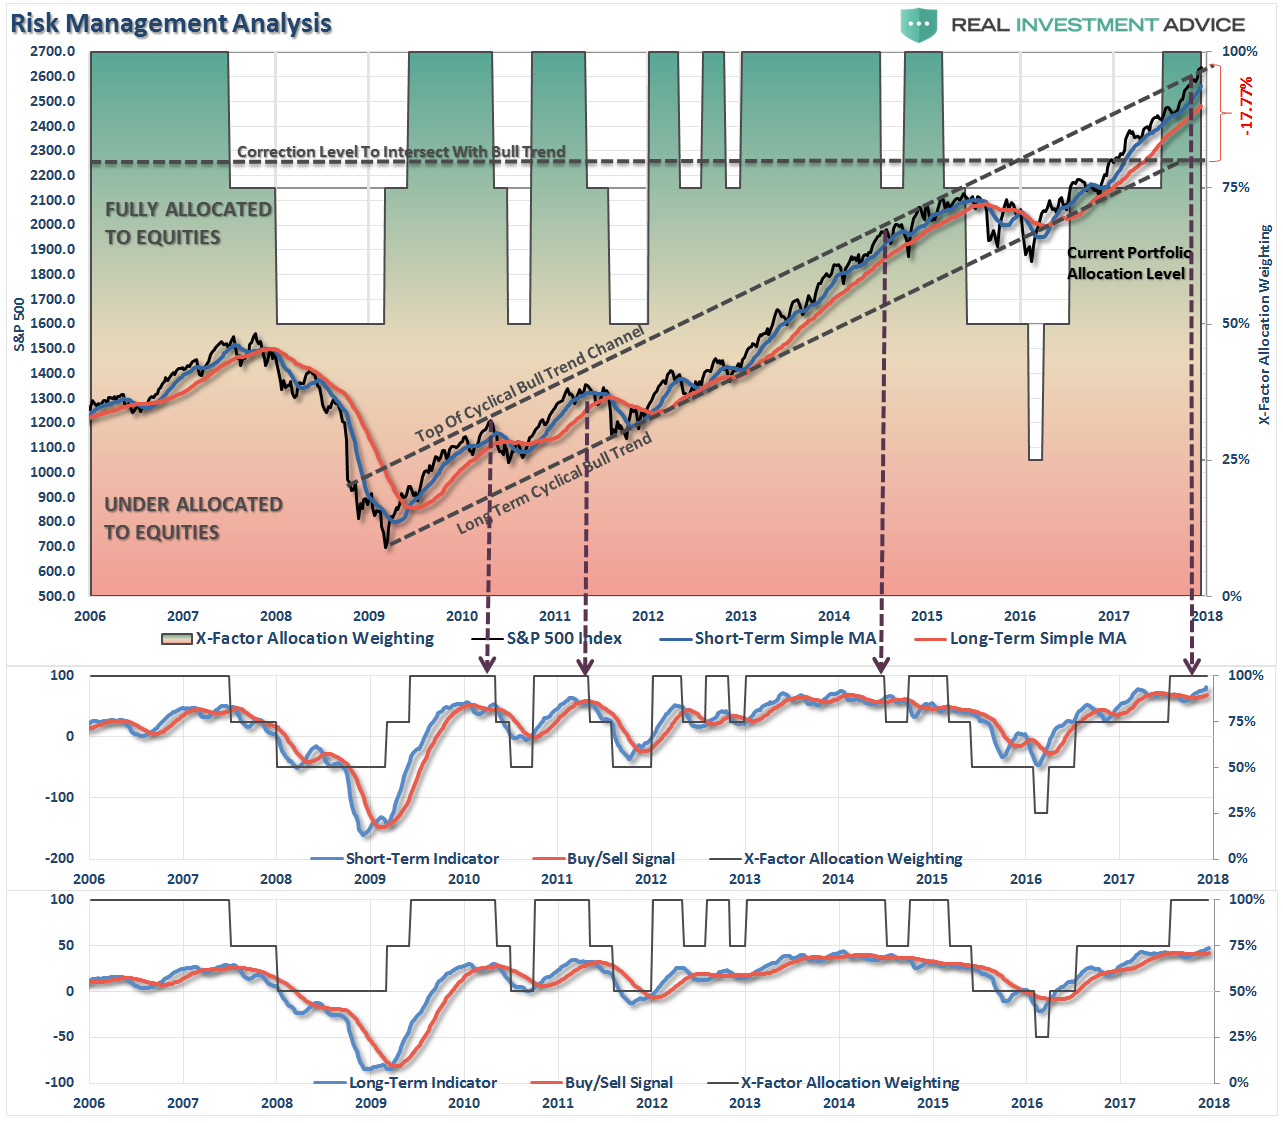
There are 4-steps to allocation changes based on 25% reduction increments. As noted in the chart above a 100% allocation level is equal to 60% stocks. I never advocate being 100% out of the market as it is far too difficult to reverse course when the market changes from a negative to a positive trend. Emotions keep us from taking the correct action.

Santa Claus Comes Early
“The surge last week keeps the ‘bulls in the driver’s seat’ which keeps portfolio allocations at target levels for now.”
Such remains the case this week, but as noted in the 401k allocation chart above, we are now at the top of the long-term bullish trend channel. As noted by the arrows, with the markets extremely overbought and extended, it suggests there is little upside from here.
This analysis remains consistent with an early-2018 tax selling correction in January. Such a correction would likely be confined to a pullback to the 200-dma, but could evolve into something larger depending on other macro-conditions.
Given the inability to hedge 401k-plans, I continue to recommended rebalancing risks in portfolios by trimming overweight equity exposure but adding to fixed income exposure.
Such actions will likely provide dividends as we move into the next couple of weeks as well as mutual funds ramp up capital gains distributions for the year. A pick up in volatility into the end of the year would not be surprising.
All NEW contributions to plans should currently be adjusted to cash or cash equivalents like a stable value fund, short-duration bond fund or retirement reserves. We will use these funds opportunistically to add to weightings when corrections occur.
If you need help after reading the alert; don’t hesitate to contact me.
Current 401-k Allocation Model
The 401k plan allocation plan below follows the K.I.S.S. principle. By keeping the allocation extremely simplified it allows for better control of the allocation and a closer tracking to the benchmark objective over time. (If you want to make it more complicated you can, however, statistics show that simply adding more funds does not increase performance to any great degree.)
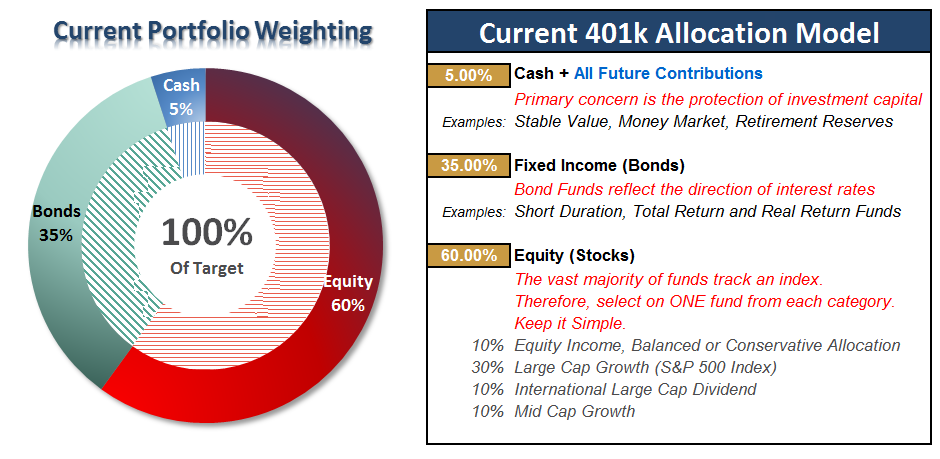
401k Choice Matching List
The list below shows sample 401k plan funds for each major category. In reality, the majority of funds all track their indices fairly closely. Therefore, if you don’t see your exact fund listed, look for a fund that is similar in nature.

Lance Roberts

Lance Roberts is a Chief Portfolio Strategist/Economist for Clarity Financial. He is also the host of “The Lance Roberts Show” and Chief Editor of the “Real Investment Advice” website and author of “Real Investment Daily” blog and “Real Investment Report“. Follow Lance on Facebook, Twitter and Linked-In