via upfina:
The May monthly construction spending report was very bad as it was down 0.8% monthly and 2.3% yearly. The weakness is in residential construction, specifically, in single family residential construction. Residential construction spending fell 11.2% yearly. Single family spending fell 7.6% and multi-family spending was up 9.3%. Single family housing has become unaffordable which is why multi-family housing is being built at a higher growth rate.
Big Decline In Residential Construction
As you can see from the charts below, spending on multi-family housing is significantly below that of single family housing, so it can’t push overall growth to the positive side.
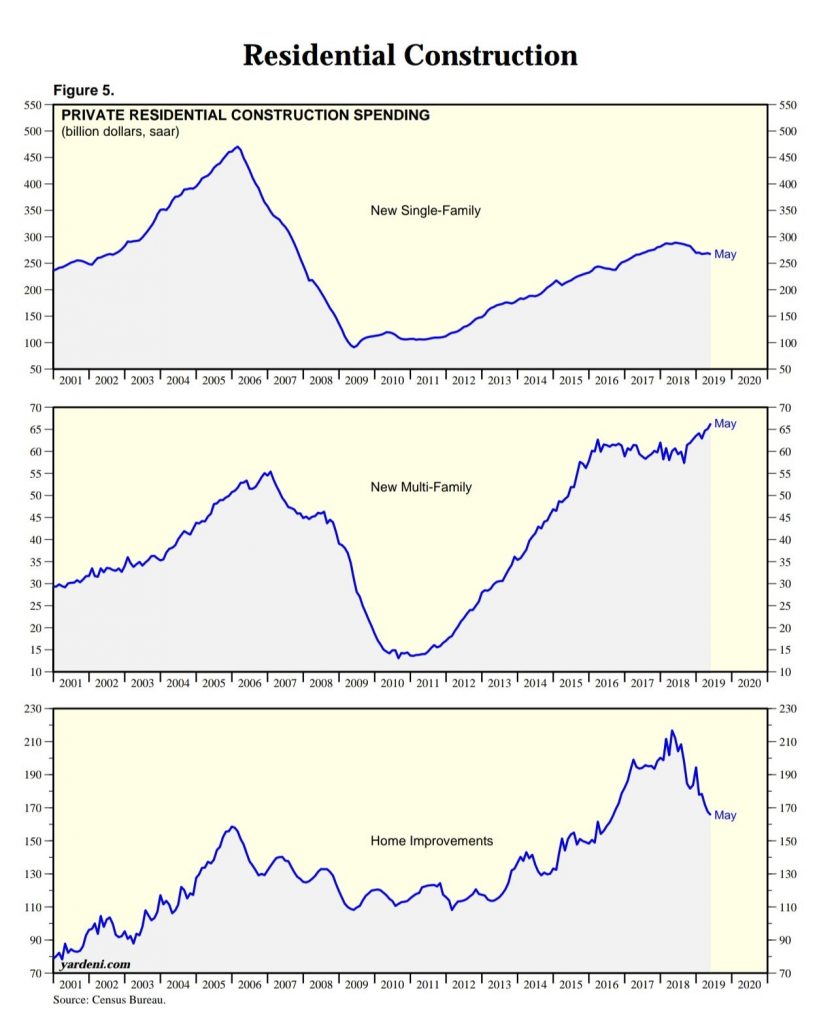
On a related note, Oregon recently passed a law that effectively bans single family zoning laws, allowing more affordable multi-family housing to be built. The weakest part of this construction report was in home improvements. Spending on them fell 22% yearly. You can see in the “home improvements” chart above how sharp the descent has been. This is a terrible sign for the health of the consumer and the housing market. It’s worth noting how Home Depot and Lowe’s stocks haven’t fallen with this index; they have rallied with the overall market.
Job Cuts Fall In June & Q2
Much has been made about the spike this year in job cuts probably because the other labor reports such as the BLS monthly report and the weekly jobless readings have been relatively strong. Layoff announcements can be thought of as a leading indicator because the announcements occur before they happen. The spike is no longer happening, so the bears don’t have that point to add to their thesis.
As you can see in the chart below, the number of job cuts in June fell from 58,577 to 41,977.
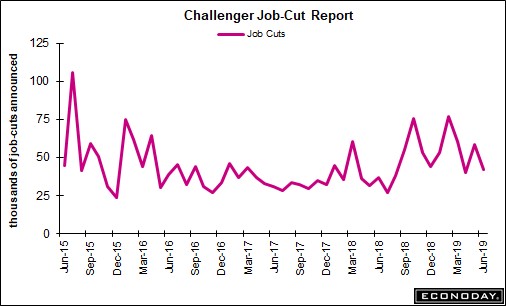
This report is highly volatile and can be manipulated by a few big companies. That’s why it’s best to look at quarterly averages. In this case, it tells us the same thing as quarterly cuts fell 26% in Q2. There were 190,410 cuts in Q1 and 140,577 cuts in Q2. On the other hand, year to date cuts are still up 35% from last year as this is the highest first half total since 2009. As you can see below, the biggest spike in the past 4 years occurred early in the 2nd half of 2015.
Weakest Non-Manufacturing PMI Since July 2017
According to the ISM non-manufacturing PMI, the services sector is in a slowdown. As you can see from the chart below, in June the PMI fell from 56.9 to 55.1 which missed estimates for 55.8 and was the weakest reading since July 2017.
The #ISM Non-Manufacturing Index has fallen to its lowest level since July 2017, but remains at a reasonably high level. pic.twitter.com/l9lvAu3xPS
— jeroen blokland (@jsblokland) July 3, 2019
This reading is decently below the 12 month average of 57.9. Even though this PMI is above the manufacturing PMI, it’s actually consistent with a lower GDP growth. That might be because the economy has grown to rely more on services for growth in the past few decades. This PMI is consistent with 2.3% GDP growth. Even with this decline that’s still higher than the median estimate of 1.7%.
The business activity, new orders, and employment indexes fell 3, 2.8, and 3.1 points to 58.2, 55.8, and 55. The business activity and new orders indexes have been in a positive trend for 119 months. This expansion is about to be 121 months old at the end of July, making it the longest one since the 1800s. Unlike the manufacturing report, the non-manufacturing prices index was up 3.5 points which means the nominal index improved.