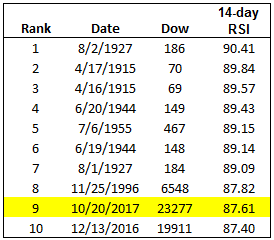
ONE OF THE MOST OVERBOUGHT MARKETS IN HISTORY
Out of 30,914 trading days, that’s good for top 10 all-time.
stockboardasset.com/insights-and-research/one-overbought-markets-history/
twitter.com/NorthmanTrader/status/921446299492409346
twitter.com/NorthmanTrader/status/921836615483514880
Americans have more debt than ever — and it’s creating an economic trap
-
An International Monetary Fund report finds that high levels of household debt deepen and prolong recessions.
-
US household debt is at pre-Great Recession levels.
-
Household debt jumped by over $500 billion in the second quarter to $12.84 trillion.
A scary little statistic is buried beneath the US economy’s apparent stability: Consumer-debt levels are now well above those seen before the Great Recession.
As of June, US households were more than half a trillion dollars deeper in debt than they were a year earlier, according to the latest figures from the Federal Reserve. Total household debt now totals $12.84 trillion — also, incidentally, about two-thirds of gross domestic product.
The proportion of overall debt that was delinquent in the second quarter was steady at 4.8%, but the New York Fed warned over transitions of credit-card balances into delinquency, which “ticked up notably.”
www.businessinsider.com/americans-are-more-indebted-than-ever-raising-economic-risks-2017-10
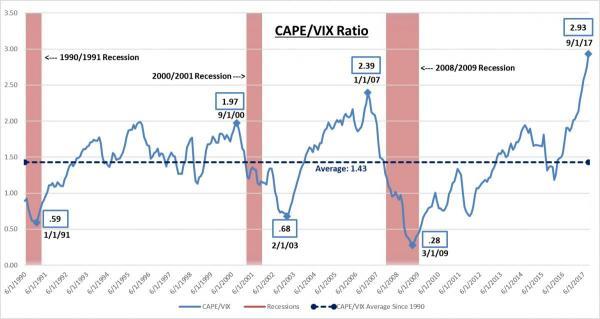
- The long term CAPE/VIX ratio suggests a strong possibility of a looming US Recession in 2018 which would be an unexpected shock to the market.
- The VIX going back to 2015 is in a clear ending diagonal suggesting historic lows will soon end.
- The Shiller CAPE at ~30 is presently registering the third highest level in recorded US Market history. The chances of it falling in 2018 are extremely high.
- The longer term VIX and CAPE charts support what the historical CAPE/VIX ratio is signalling.
We were in the process of writing about the technical pattern in the VIX when we came across some research by Peter Schiff of Euro Pacific Capital illustrating the historical correlation of the CAPE/VIX Ratio to US Recessions go back to 1990. We have been warning about a unexpected US Recession scare coming in 2018.
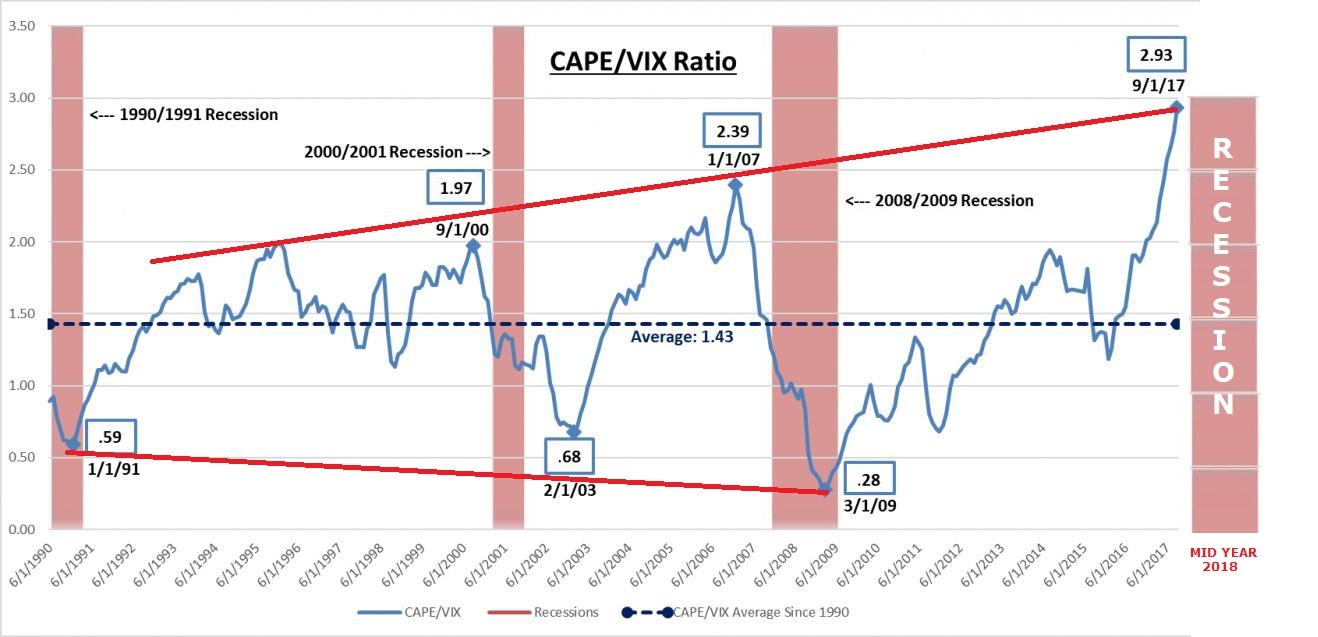
A fairly reliable technical indicator is a megaphone topping pattern. We annotated Schiff’s chart to more visibly reflect this.
If the possible message this chart is sending then we should soon see the VIX rise and the CAPE fall. Is this reflected in the VIX and CAPE technicals.
stockboardasset.com/insights-and-research/capevix-ratio-tells-us-likely-looming-ahead/
— Alastair Williamson (@StockBoardAsset) October 23, 2017
It's happening again— Telecoms slide <50sma monthly pic.twitter.com/vLmhqrpwd9
— Alastair Williamson (@StockBoardAsset) October 23, 2017
Debt Growth Is Holding Back GDP
Even though growth is picking up, credit rating agency Moody’s argues that this growth will not make it any easier for policymakers to raise interest rates.
In a research report published at the end of last week, Moody’s analysts point out that the “downshifting of US real GDP’s 10-year average annual growth rate has coincided with a climb by the ratio of nonfinancial-sector debt to GDP.” In other words, slowing economic growth has resulted in more leverage:
“When the average ratio of nonfinancial-sector debt to GDP rose from the 135% of 1960-1984 to the 175% of 1985-2001, the average annualized rate of real GDP growth slowed from 3.6% to 3.3%, respectively. In conjunction with the 229% average ratio of debt to GDP since 2001, real GDP growth has slowed to 1.9% annualized, on average.”
Uh Oh BOJ pic.twitter.com/LwOK5owh7m
— Alastair Williamson (@StockBoardAsset) October 23, 2017
As long as the Fed continues to print free money and shovel it into the markets, there really is no end to how high it can go, is there?
https://uploads.disquscdn.com/images/be6a9dec73181d400183bce70ffef3dc5bdfe07e908a6498cedc0fee53b52bfc.jpg
This next crash will be the mother of all crashes. America’s remember the federal reserve gave us this $hit gift.