According to the United States Bureau of Labor Statics, the average annual expenditures during this period were $50,486. Northeast spending was $54,918, Midwest spending was $47,846, Southern spending was $46,823 and Western spending was $55,453.
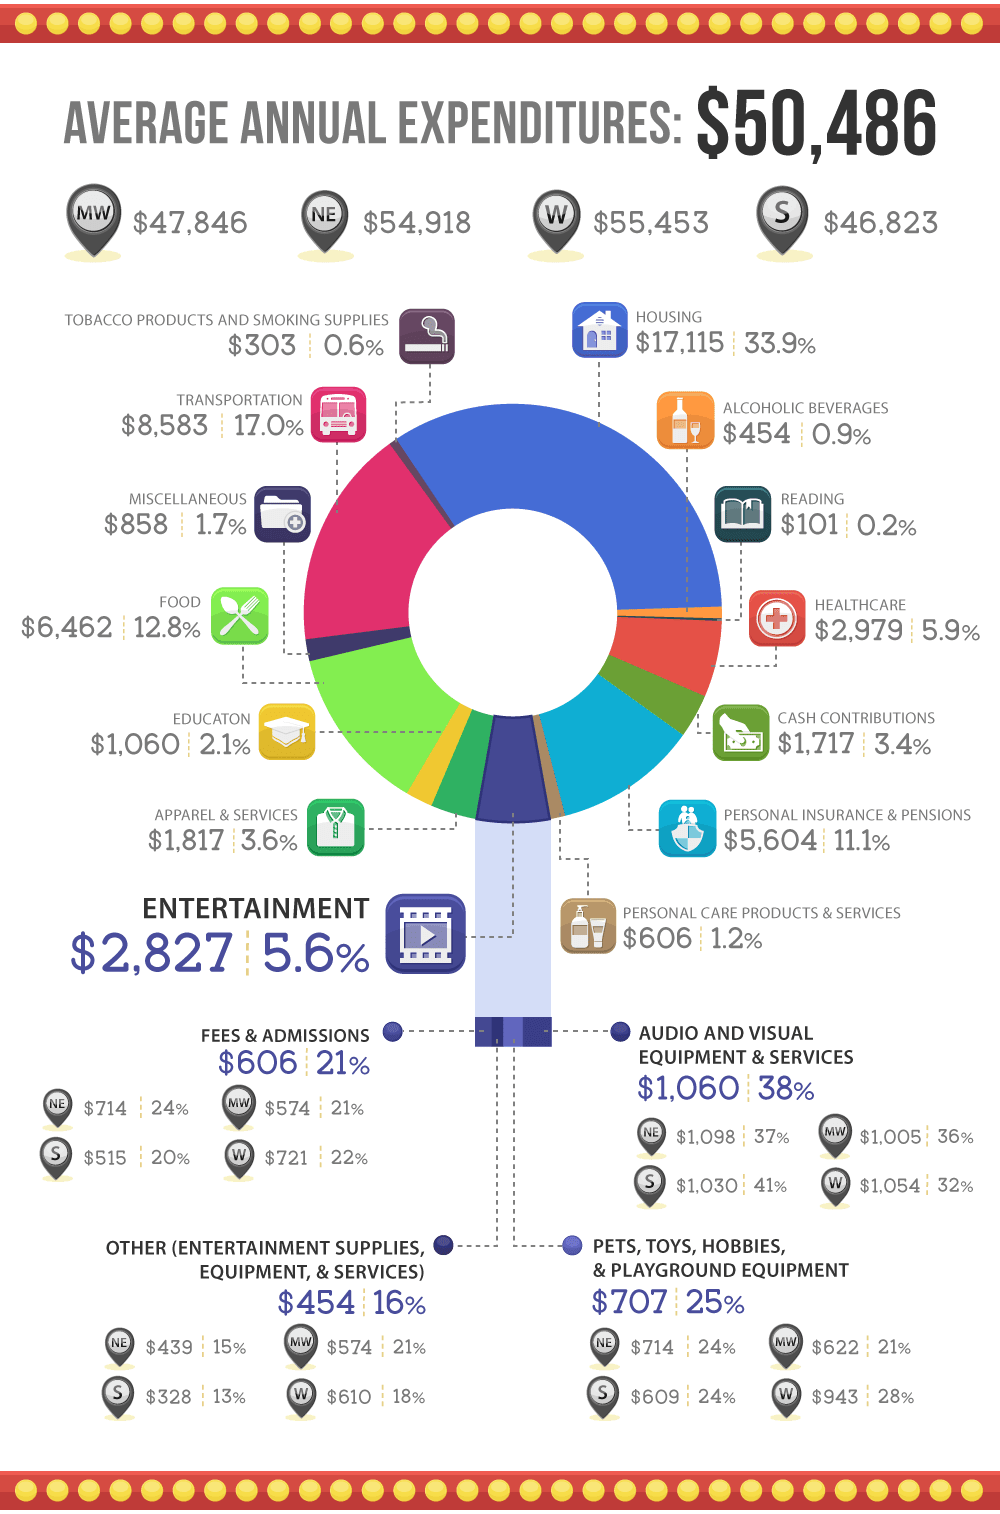
The average annual expenditures break down as follows:
- Housing – 33.9 percent, or $17,115
- Transportation – 17 percent, or $8,583
- Food – 12.8 percent, or $6,462
- Personal insurance and pensions – 11.1 percent, or $5,604
- Health care – 5.9 percent, or $2,979
- Entertainment – 5.6 percent, or $2,827
- Apparel and services – 3.6 percent, or $1,817
- Cash contributions – 3.4 percent, or $1,717
- Education – 2.1 percent, or $1,060
- Miscellaneous – 1.7 percent, or $858
- Personal care and services –1.2%, or $606
- Alcoholic beverages – 0.9 percent, or $454
- Tobacco products and smoking supplies – 0.6 percent, or $303
- Reading – 0.2 percent, or $101
— Read more at https://www.creditloan.com/blog/average-american-spends-on-entertainment/
This is meant in no way to provide financial advise to your particular situation. I just wanted to share it as a reference point in case people were interested.
The median household income in 2014 was $73,298.
According to the U.S. Census Bureau, the average household income was $73,298 in 2014, the latest year for which complete data is available. However, this doesn’t tell the whole story. Depending on your family situation and where you live, average household income can vary dramatically.
This is per consumer unit. The average consumer unit makes $74,664 pre-tax.
Consumer units include families, single persons living alone or sharing a household with others but who are financially independent, or two or more persons living together who share expenses.
https://www.bls.gov/news.release/cesan.nr0.htm
h/t Theocletian