via Eric Basmajian
- Retail sales declined month over month for three consecutive months.
- The last time there were three consecutive monthly declines in Retail Sales was in 2015.
- The consumer is stretched and it’s starting to show up in the data as we have been forecasting at EPB Macro Research.
RETAIL SALES
Each month, the Census Bureau publishes the Advanced Monthly Retail Trade report. The Advance Monthly and Monthly Retail Trade Surveys (MARTS and MRTS), the Annual Retail Trade Survey and the Quarterly E-Commerce Report work together to produce the most comprehensive data available on retail economic activity in the United States.
This is one of the most important macroeconomic reports as it pertains to the consumption side of the economy. Consumption is about 70% of the total economy so the retail sales report provides critical insight into the health of the economy on a relatively high-frequency basis.
The retail sales control group, the number that feeds into the GDP report, increased growth slightly to 4.18%. This number is not adjusting for inflation. The chart below clearly shows periods of accelerations in growth and decelerations in growth that have been closely correlated to the broad economic cycle.
Retail Sales Control Group Year-Over-Year Growth:
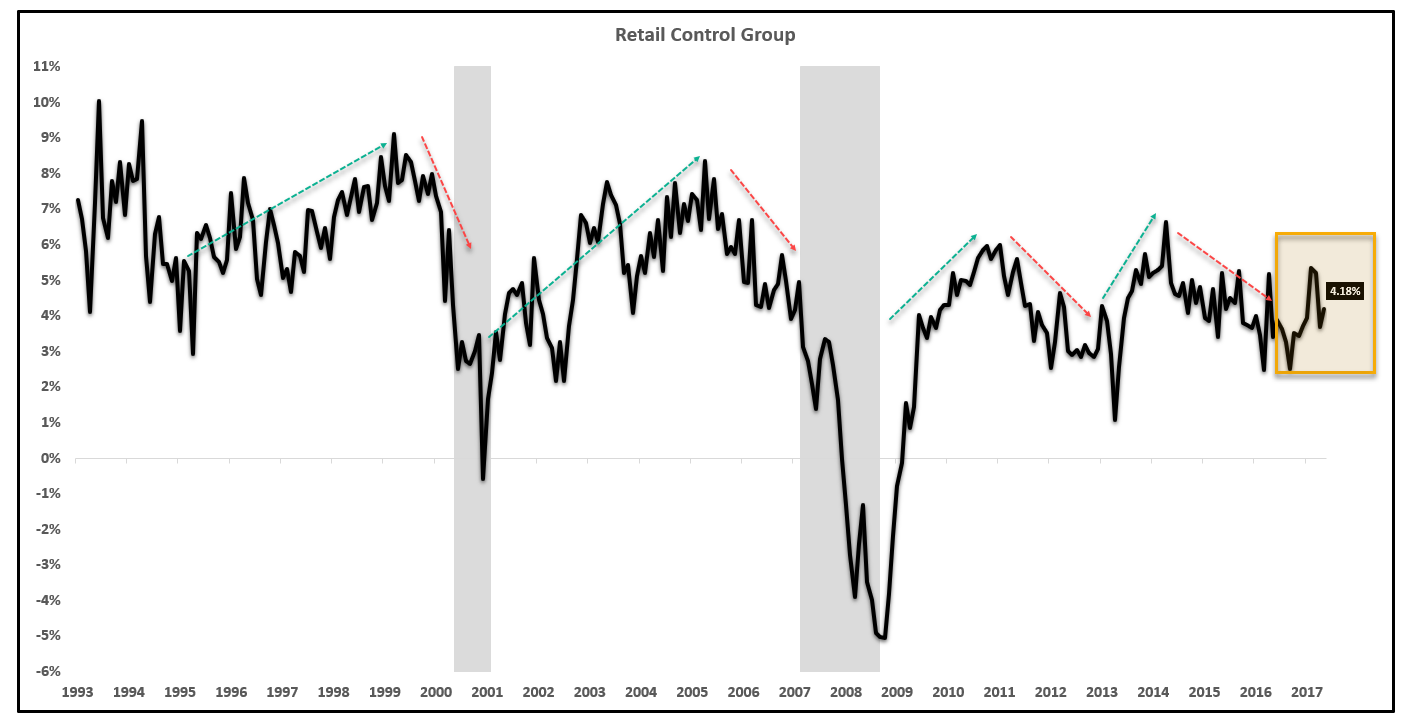
The economy decelerated materially in terms of retail sales growth from the 2015 peak until today. Over the last three to six months, there was a slight recovery in the growth rate of retail sales but there is not enough evidence to say a new trend is formed or that the downward trend will continue.
The only thing we can discern from the data is that the economy is growing at a slower pace than 2015 and the recent data is fairly trendless in terms of retail sales growth. Based on the plethora of other growth slowing data points, the probability is that the growth rate of retail sales will resume the downward trend.
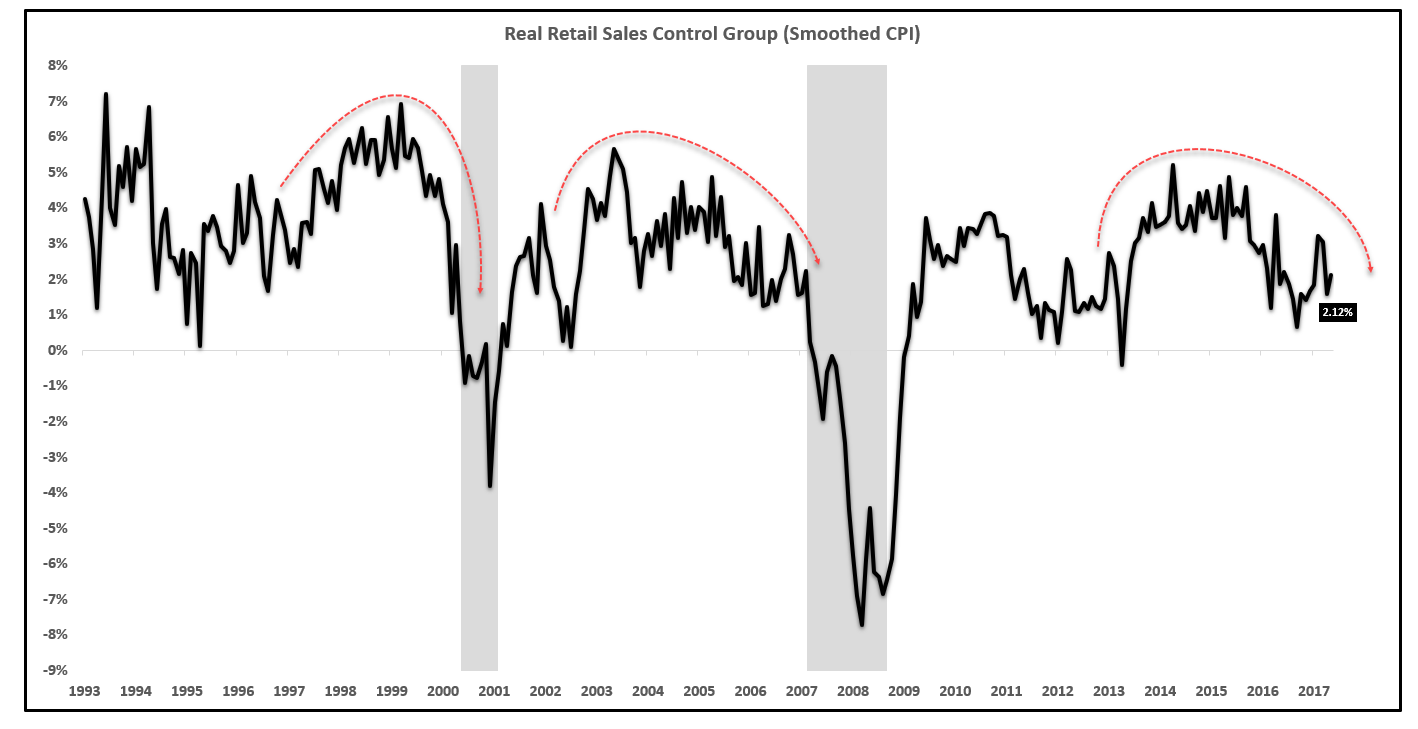
Real retail sales, adjusted for inflation, also shows a broad cycle rollover from the 2015 peak. As previous cycles show, the lead-lag time from the cycle peak to the recession can vary, but once the cycle peaks, it is unlikely to see growth surpass the previous high for the cycle. It is therefore unlikely, despite the narrative, that retail sales growth or overall growth will surpass the 2015 level.
In fact, based on the data, the short-term peak in growth is in the rear-view mirror. There was a short-term peak in January 2017 and the economic data has been weak since then. After inflation, retail sales are growing at 2.12% year over year relative to almost 5% in 2015.
Real Retail Sales Control Group (Smoothed CPI) Year-Over-Year Growth:
Similarly, the peak in growth and subsequent decline can be seen in the most powerful growth category, online retail sales growth. The peak in growth was in 2015 and while the growth rate is still ‘good’, the economy has empirically decelerated since the 2015 peak.
Online Retail Sales Growth:

The spread between headline inflation and core inflation also shows signs consistent with economic slowdowns and headwinds to retail sales. The spread below attempts to capture the impact on higher oil prices to the retail sales and consumption basket. If oil is rising faster than core inflation, the consumer margin declines and if oil is rising slower than core inflation, this is a tailwind to overall consumption growth.
Historically, you can see the spread increasing and therefore, the consumer margin shrinking into each recession. Today, the spread is increasing as oil prices rise faster than overall inflation, negatively impacting the retail sales consumption basket for consumers.
Headline – Core Inflation Spread:

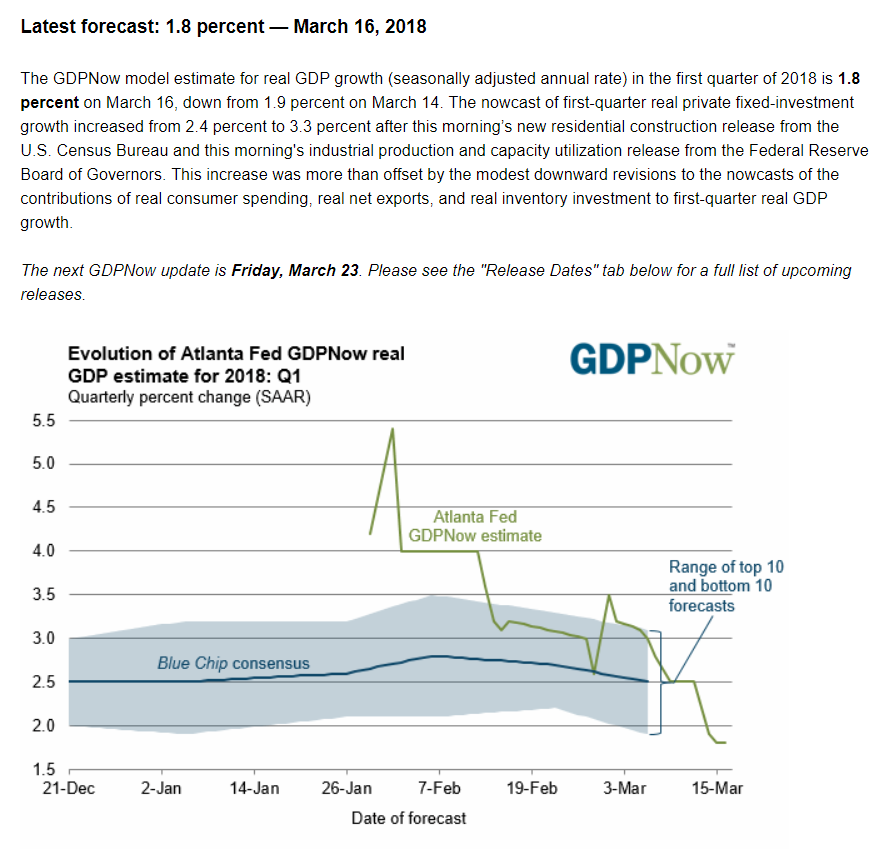
The Atlanta Fed GDP forecast has dropped down to 1.8% for Q1 2018, slowing moving in line with our growth slowing forecast over the past several months.
Atlanta Fed GDP Now:
WHY HAVE RETAIL SALES BEEN SO WEAK?
Many long-term followers are aware that I have been calling for a significant slowdown in consumption due to the stretched position of the average US consumer.
In December 2017, I wrote a research note titled, “The Consumer Is Maxed Out – A Theme To Watch In 2018”
In that research note, my main points arguing for a future slowdown in growth included credit growth far in excess of income growth, low personal savings rate, and rising interest expenses.
Below is a small excerpt from that report in December 2017:
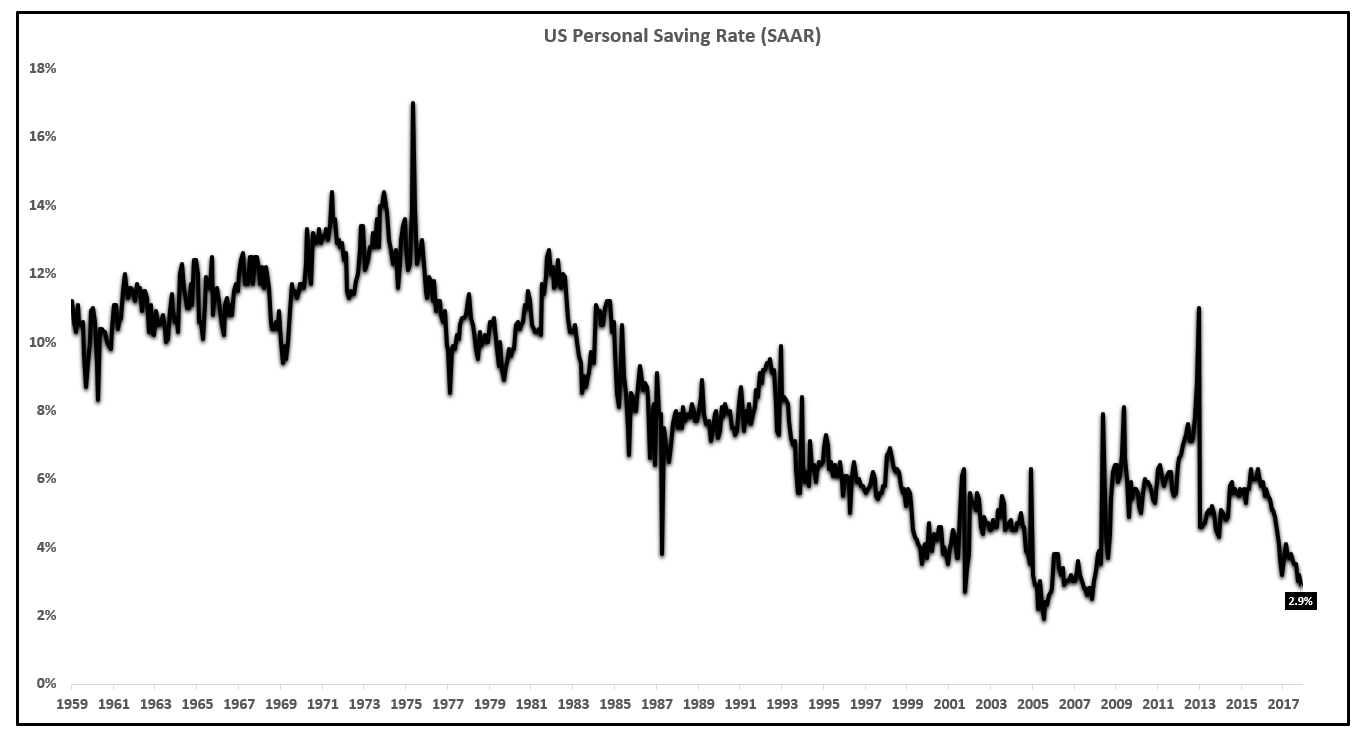
There are many indicators that are strongly suggesting the consumer is running out of steam and consumption growth will be weaker in 2018 than in 2018. The economy, despite the tax cuts, is likely to slow in 2018, exacerbated by aggressive Federal Reserve policy. The peak for this cycle has already been registered, noted by the yellow box. It is always possible for income growth to accelerate materially, but the historical evidence suggests that the peak in income growth is behind us, and we will start to see decelerations in income growth as we are near the end of a 100+ month economic expansion, the second longest on record. The consumer is already completely maxed out in terms of spending. The personal savings rate hit a new low, down to 2.9%.
Personal Savings Rate:
There is essentially no room for the savings rate to go much lower, so consumption has to go down or credit has to increase in order to maintain consumption growth.
If the savings rate goes up, consumption must fall. Consumers are limited in the amount of credit they can accumulate. If consumers are reaching for credit and are fully maxed out, and that has equated to flat consumption growth of 2.7%, that is a very weak underlying economy.
I will update the key metrics including credit growth, the savings rate and income growth below.
Consumer credit growth decelerated materially from 2016 to the middle part of 2017. As euphoria in the stock market (SPY) rose in the latter part of 2017 along with general positive ‘hopes’ for the economy, hopes that have yet to materialize, consumers felt more comfortable increasing credit growth, despite a lack of income growth.
Consumer Credit Growth:
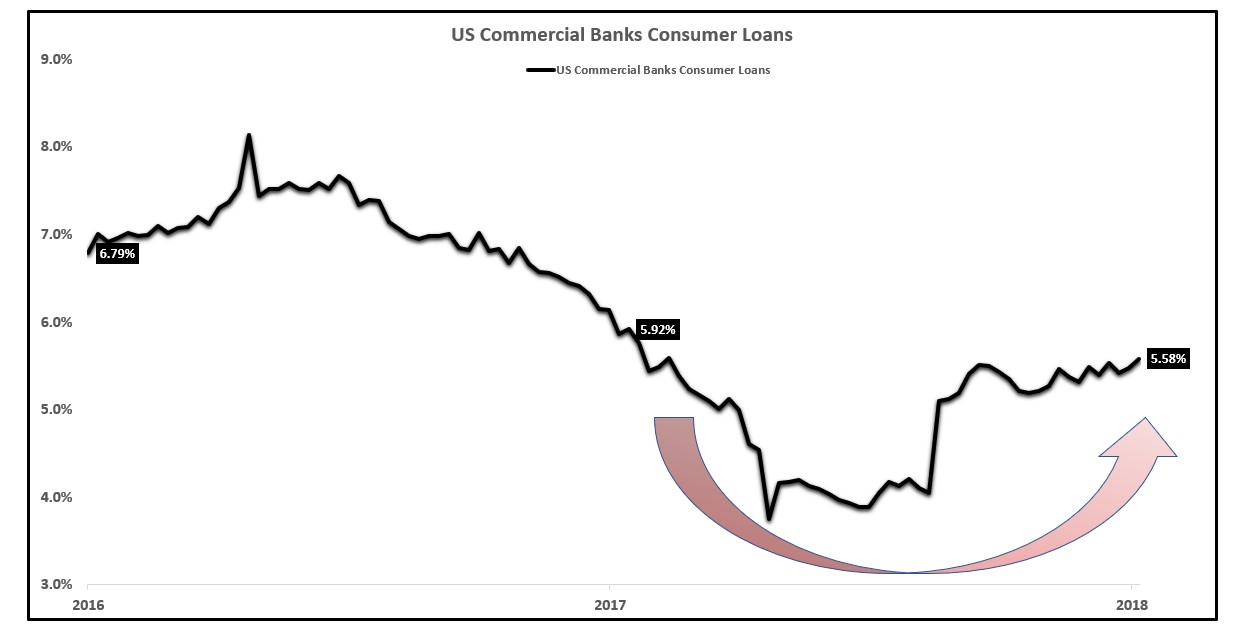
Current consumer credit growth is increasing at a pace of roughly 5.6% annually. As credit growth accelerates, personal interest payments increase leaving less disposable income for savings and consumption.
Total income, which includes dividends, interest, wages, government programs etc., can be thought of as the consumers’ ‘revenue’ or top line.
From the top line, less personal current taxes to find disposable personal income.
The hope for the Trump economy is that the personal taxes line shrinks, leaving more money for savings, consumption and other productive uses of capital rather than paying interest on the debt, a low-velocity use of capital.
While it is very early and it will likely take several months for the impacts of the tax cut to trickle through the economic data, the data as of now shows no evidence of rising income growth and in fact, the data is pointing to the contrary with weak consumption numbers for the January and February reporting periods.
After subtracting personal taxes from total income, all other expenses are deducted and the final number left is the ‘personal savings rate’.
As the data empirically shows, consumers are reducing savings, increasing credit and that STILL results in negative consumption growth month over month and decelerating year-over-year growth.
If the consumer was ‘healthy’, why has the personal savings rate dropped to decade lows?
Personal Savings Rate:
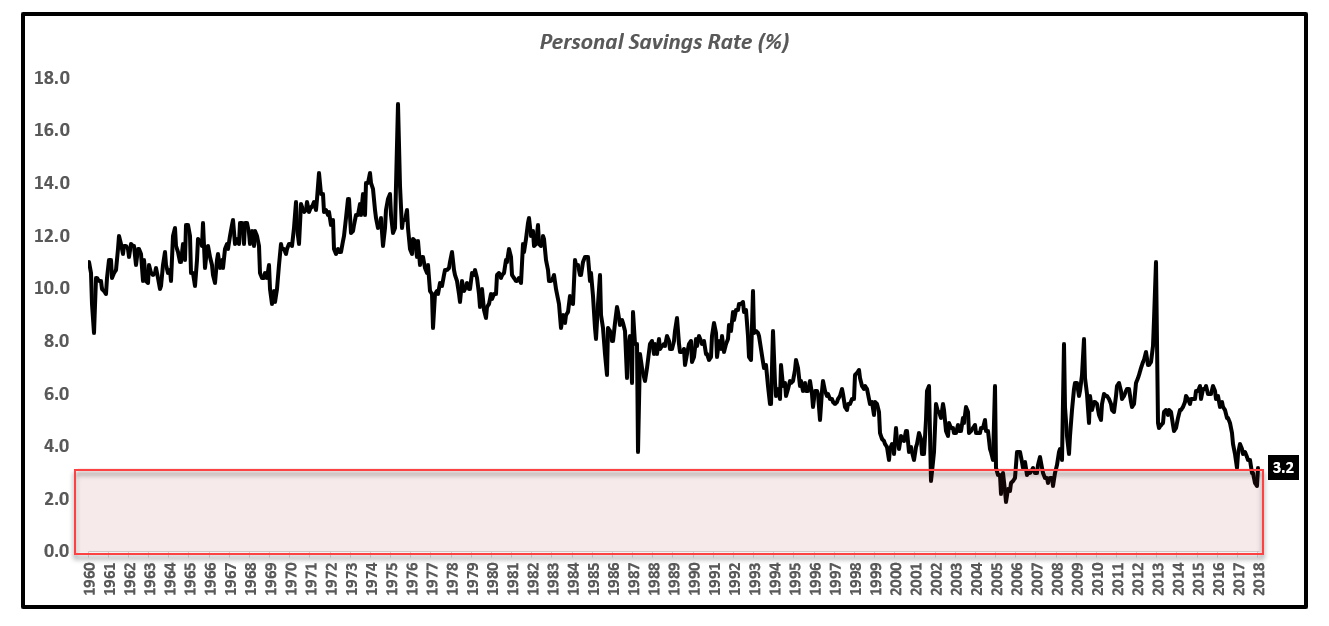
The bulls of the economy fail to prove where the marginal consumption will come from. Yes, tax cuts are in effect and will likely lower personal taxes but the data is very clear that for one reason or another, consumers desire to increase credit and save less.
It would be another story if credit increased and savings declined yet consumption growth soared. That is not what is happening.
Disposable income growth per capita, NOT adjusted for inflation, is currently increasing at a pace of 3.2% annually.
Disposable Income Growth Per Capita:
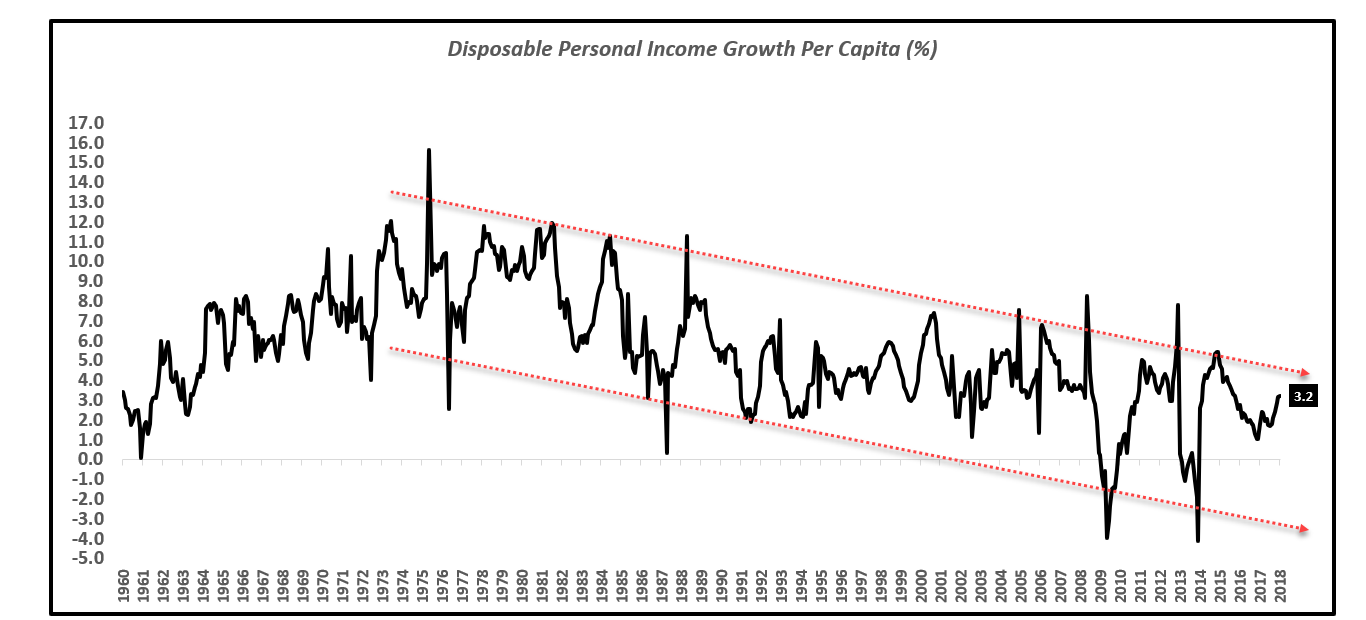
It is not a challenge to see that credit growth of 5.6% with income growth of 3.2% is not a sustainable situation and eventually, credit growth will have to slow, savings will have to rise and consumption, therefore, by the simple definitions of the metrics, will have to decline.
It is possible that we are seeing the early stages of a multi-year decline in consumption growth that has started with declines in growth for January and February. It may be slightly early to call that trend definitively, but one can be significantly more confident in the assertion that consumption growth has little to no chance to materially accelerate with a savings rate of 3%, income growth of 3% and credit growth of 5.6%.