The US stock market will soon experience its second crash for 2020. My continuing empirical research of market crashes resulted in two new metrics being discovered. The combined two indicate that another violent market crash for 2020 is inevitable.
These metrics power the MKT Crashometer algorithm which
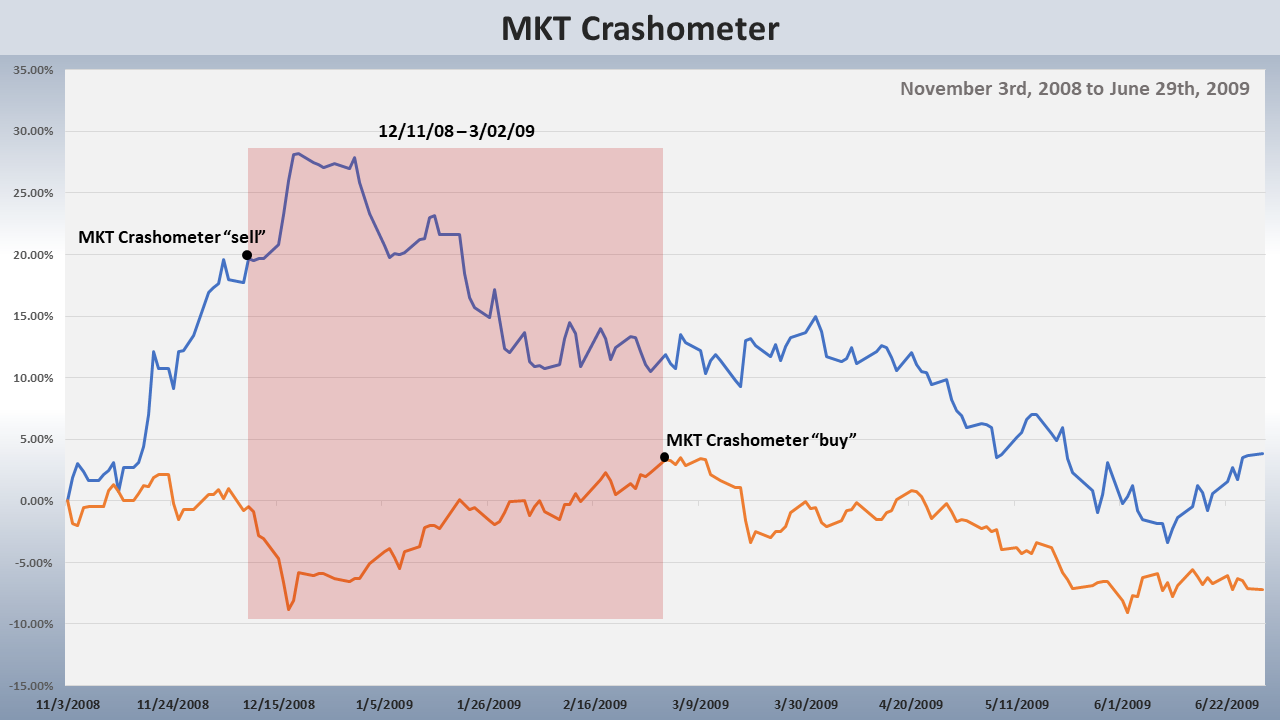
The chart for the MKT Crashometer below depicts the spread between the two metrics widening significantly (see red arrows) starting on February 20, 2020, which coincided with the all-time high for the S&P 500. After the markets crashed, the spread then narrowed to its 2020 low (see vertical green dashed line) which coincided with the March 23, 2020 crash bottom.
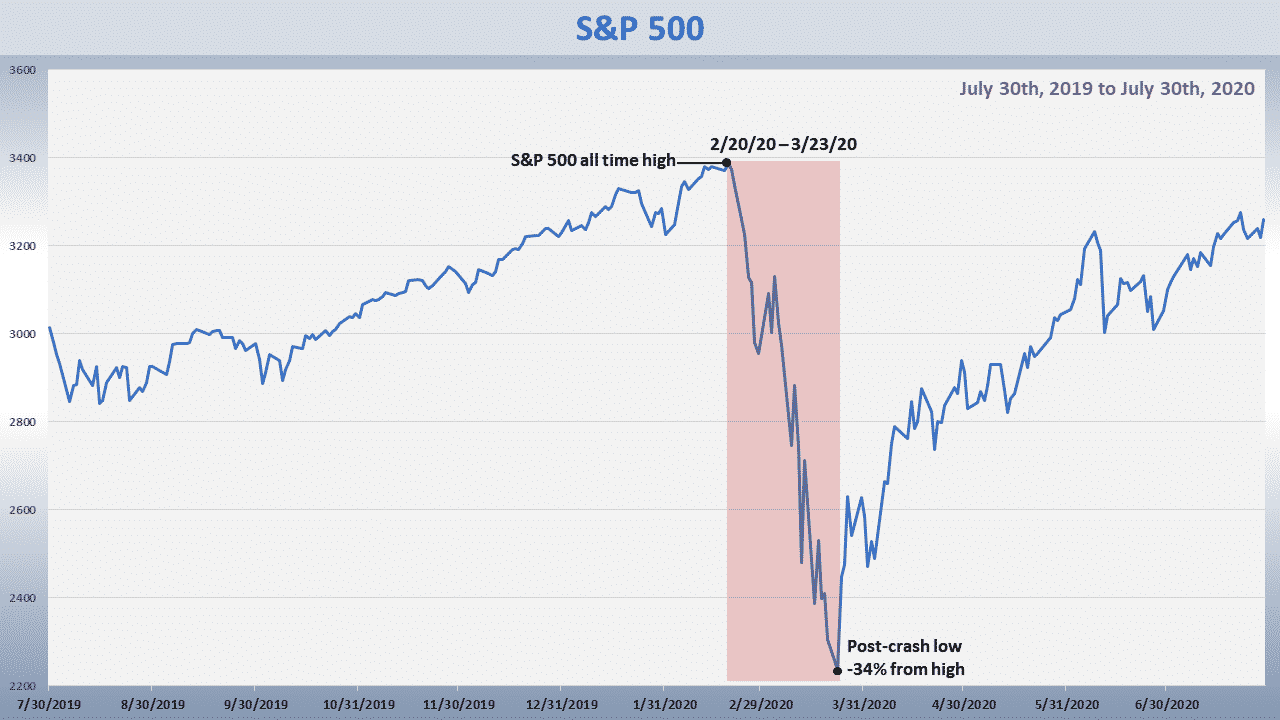
The chart for the S&P 500 below depicts the performance of the S&P 500 over the same period. After the MKT Crashometer issued the crash alert as depicted in the above chart, the S&P 500 declined by 34%.
The 2020 crash was not the first crash that the MKT Crashometer could have predicted, had it been operational. The chart below depicts the spread between the two metrics beginning to widen in the last half of November 2008. On December 11, 2008; the spread had widened to a margin that necessitated the issuance of a sell signal. The spread then narrowed in early March 2009 to a margin at which a buy signal could have been issued.
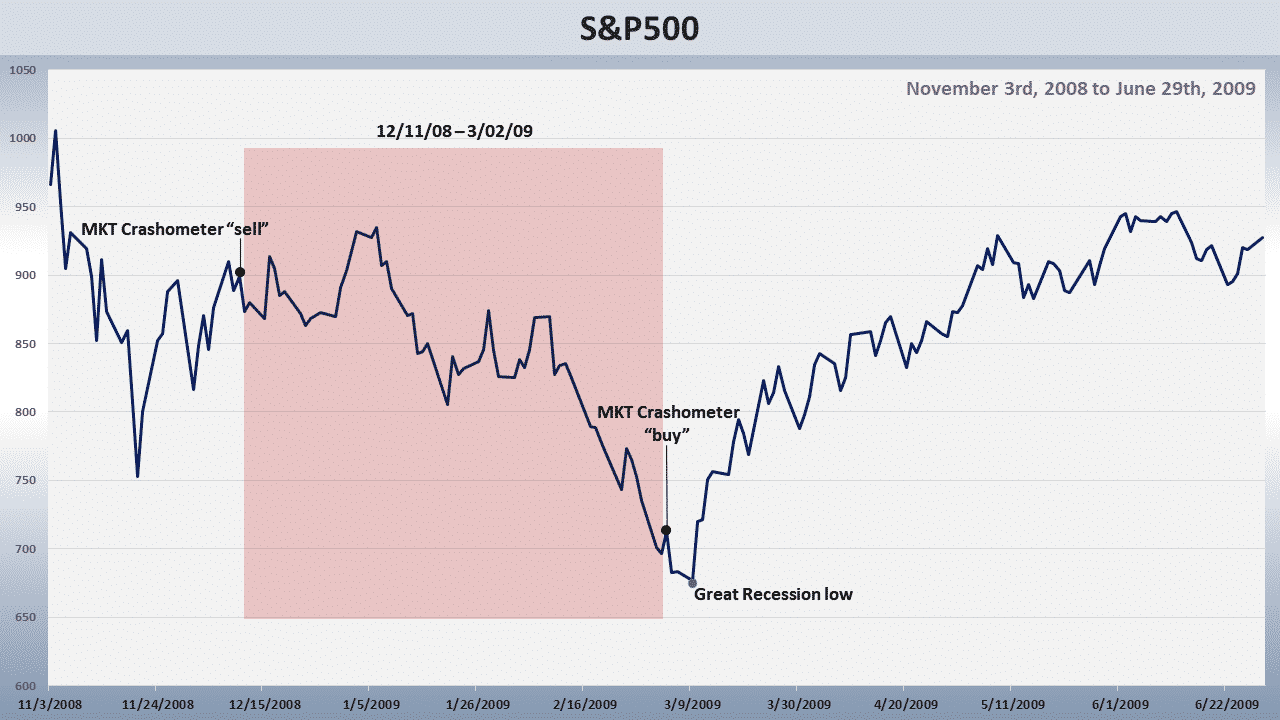
The chart below depicts that S&P 500 during same time period as the chart above. The 20% move higher by the S&P 500 from November 11, 2008 to December 8, 2008; convinced many investors that the final bottom for the crash of the Great Recession had been made. Had the MKT Crashometer been operational, it would have saved investors 20% from December of 2008 to March of 2009.
The chart below depicts that the MKT Crashometer’s spread as of July 30, 2020; was at its high for the year. This coincides with the NASDAQ & S&P 500, which as of 7/31/20, were either at or near their all-time highs.
The only remaining questions to be answered are:
- What will cause the crash to begin?
- When will crash begin?
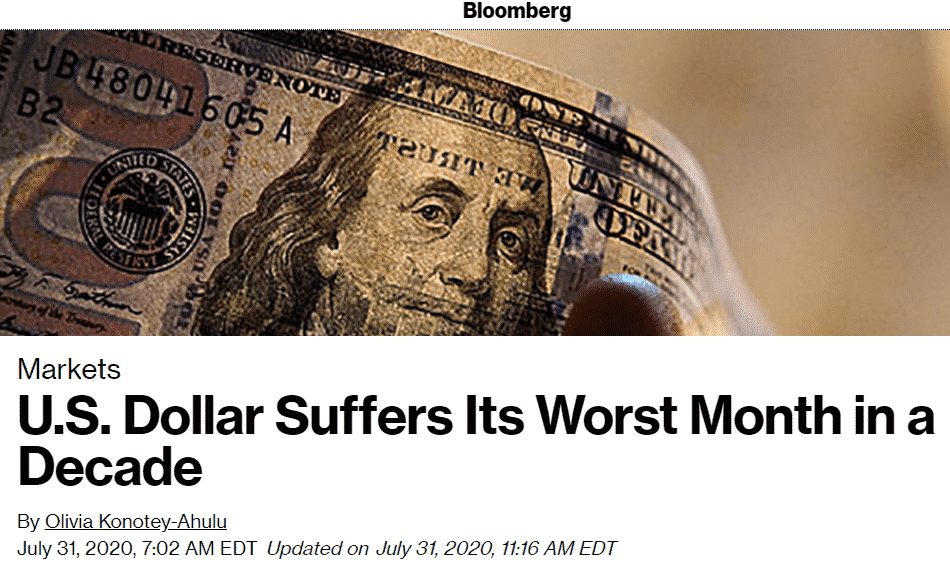
The primary catalyst which causes crashes is the wholesale and indiscriminate selling of stocks. What will cause this to happen has already occurred. It was the significant decline of the US Dollar versus all currencies since May 2020. As of July 30, 2020; the US Dollar index declined to its lowest level since April 2018.
After a steady decline since July 2018, the Euro reversed and just recently reached a two year high vs. the US Dollar. July 2020 was the Euro’s best month vs. the US Dollar since 2010.
The Dollar’s weakness poses a big problem for all US stocks. The chart below depicts that foreigners owned 35% of the S&P 500 as of 2018.
Also, in a June article, Goldman Sachs disclosed the largest buyers and sellers of US stocks for the first quarter of 2020 as depicted in the table below.
| Largest buyers and sellers of US stocks
3 months ended March 31, 2020 |
||||||||||||
|
Goldman’s projection that foreigners would be the biggest buyers of US stocks ($300B) for the year was likely made under the assumption that the Dollar would remain in an uptrend or at least be stable. However, the chart below of the Dollar index depicts that since May the US has made new lows for 2020. The greenback has since declined by more than 6%.
My experience with European money managers and advisors is deep. I worked in Europe early in my career and was with clients in Europe during the Crash of 1987. Unlike the US, European investment advisors base their investment decisions first and foremost on currency allocations. This is especially true for Switzerland and Luxembourg.
The mandate of a European money manager is to diversify the client into multiple currencies including the Swiss Franc, Euro, British Pound and Japanese Yen, etc. Only after the currencies have been allocated, can the investments in a particular currency be made.
The problem for the stock market of every country in the world is that currency allocations are adjusted either monthly or quarterly for all clients. If a currency has declined and is trending lower, its allocation is reduced or even eliminated. Upon a currency allocation change, the investments in a portfolio that are relative to that currency are immediately liquidated.
To have a full and clear picture of what is going on one must grasp the Fed’s end game. The Fed’s tactic is to debase the US Dollar for the purpose of saving the US economy vis-à-vis US goods selling globally at comparatively lower prices. The chart below depicts that the US Dollar index is likely to decline by a minimum of 20% from its 2020 high of approximately 100. Consequently, the US stock market will likely plumb to new lows. Eventually the Federal Reserve Chairman Jay Powell will be seen as a “wolf in sheep’s clothing” by stock market investors.
The probability is high that August will mark the beginning for the liquidations of US stocks by European mangers. Due to the recent negative headlines about the Dollar and the Euro, it’s inevitable that the Dollar’s weighting for non-US investment clients will be reduced or eliminated altogether.
Based on the Forex headlines and my offshore experience, the investment managers of non-US clients in Europe will have no choice but to reduce US Dollar allocations while increasing Euro allocations.
European manager and client monthly and quarterly meetings will begin in earnest next week and will continue through October 2020. Upon the currency allocation adjustments, all US stocks and bonds in a European’s portfolio will be immediately and indiscriminately liquidated at “sell at market” prices.
The SCPA (Statistical Crash Probability Analysis), another algorithm which evolved from my empirical research of market crashes, has forecasted the following for the stock markets of the US along with a dozen other countries:
- 30 to 32-month declines to final Q4 2022 bottoms
- 79% to 89% declines from 2020 highs at bottoms
- Gains of 300% from a trading short index ETFs from the peaks to the valleys during journeys to the final bottoms
- Post-crash high date before journey to final bottom as early as June 24, 2020 and as late as September 18, 2020.
The table below contains published forecasts made by the SCPA. Investors would be well advised to spend time learning about the SCPA. The forecasts are based on two prior crashes sharing the same genealogy as the crash of 2020.
The best way to profit from the inevitable second crash for 2020 is to trade inverse ETFs which go up in price when the market goes down. The subscription products in the table below are powered by algorithms which were developed from empirical research on market crashes. Both of the subscription products utilize inverse market index ETFs.


