Today, economy watchers were treated to more of the same from the housing market. That is, more weak numbers suggesting we may have seen the peak in housing activity for the cycle. This fits with our earlier analysis that higher lending rates – a function of both long-term government bond yields and short-term funding costs for banks – are starting to permeate one of the most cyclical areas of the economy. It is the consequence of monetary policy tightening, which as we know produces its intended effects with “long and variable lags”.
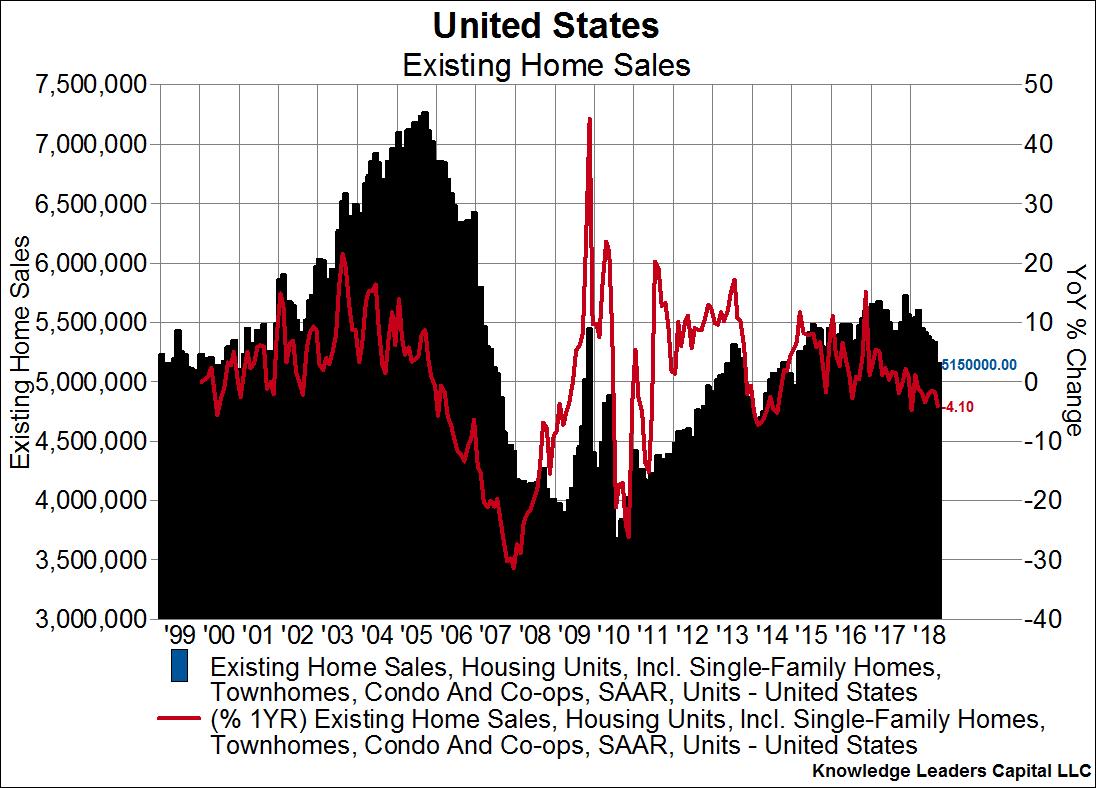
The metric of interest today is existing home sales. The reading came in at 5.15m units, which was well below the estimated 5.3m units and 4.1% below year ago levels. As the chart below shows, existing home sales have been falling all year long, and year-over-year growth rates have been mostly negative since September, 2017.
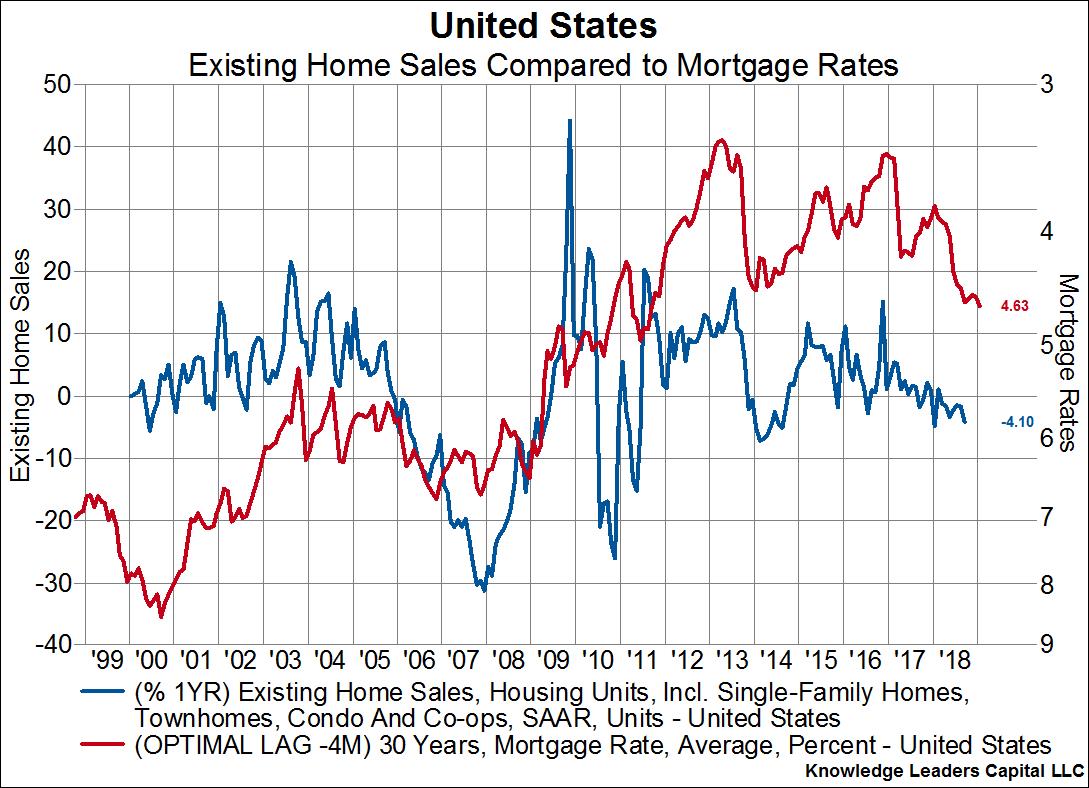
What’s more is that we should expect continued slowing in housing going forward. As the next chart below shows, mortgage rates (the red line on the right, inverted axis) lead the growth rate of existing home sales (blue line on the left axis) by four months.
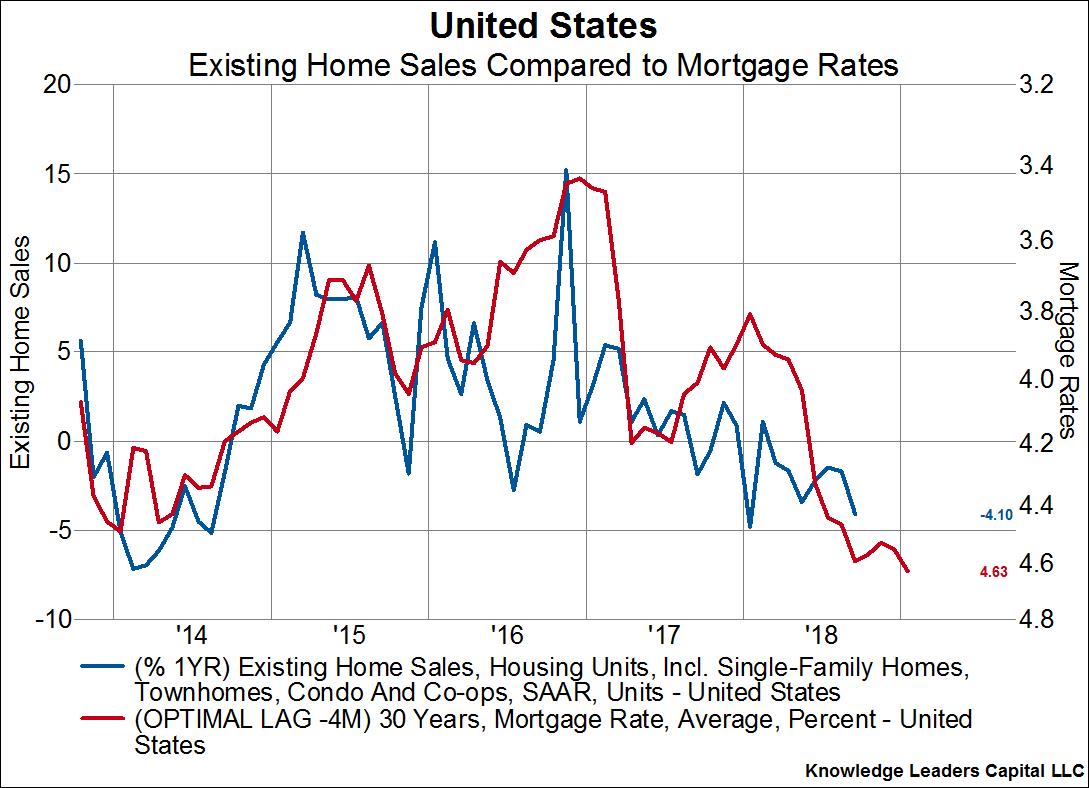
Here is a closeup showing the same relationship over just the last five years. Higher mortgage rates are telegraphing a 7% year-over-year drop in existing home sales by January 2019.
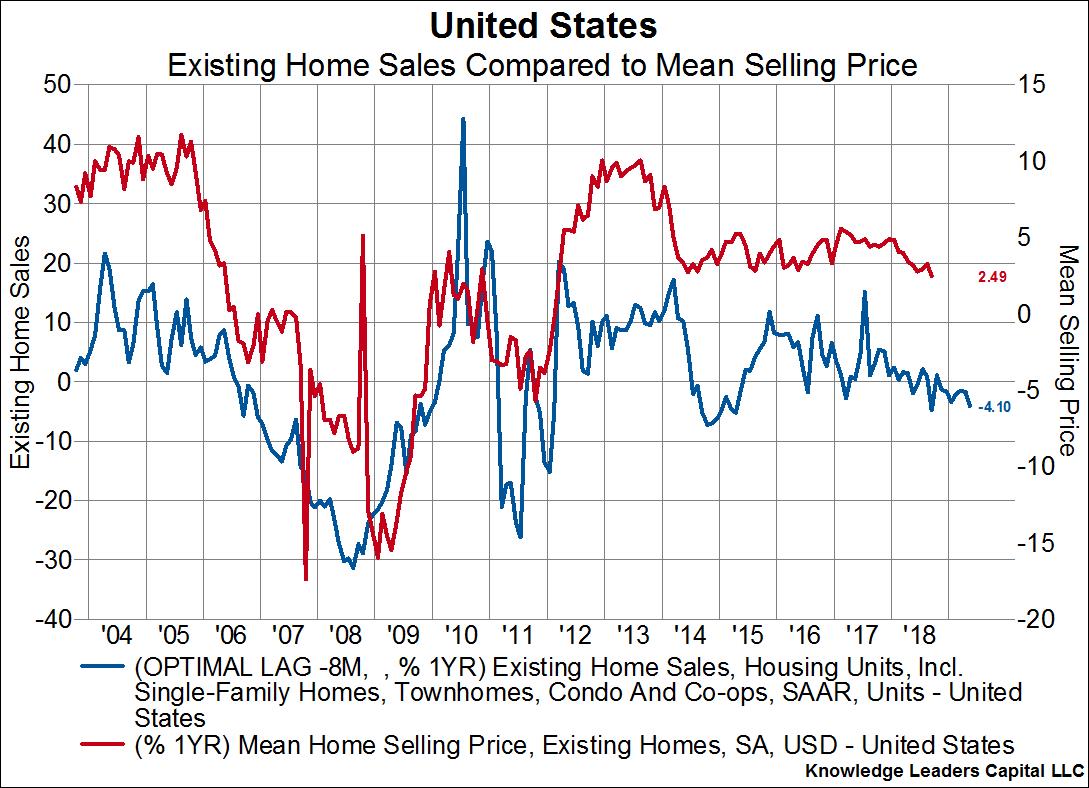
The slowdown in home sales is likely to put pressure on prices. The below chart overlays the mean home selling price (red line, right axis) on top of existing home sales (blue line, left axis). Existing sales lead the selling price by eight months, and are telegraphing the slowest year-over-year growth in home prices since early 2012 when prices were on an upswing.
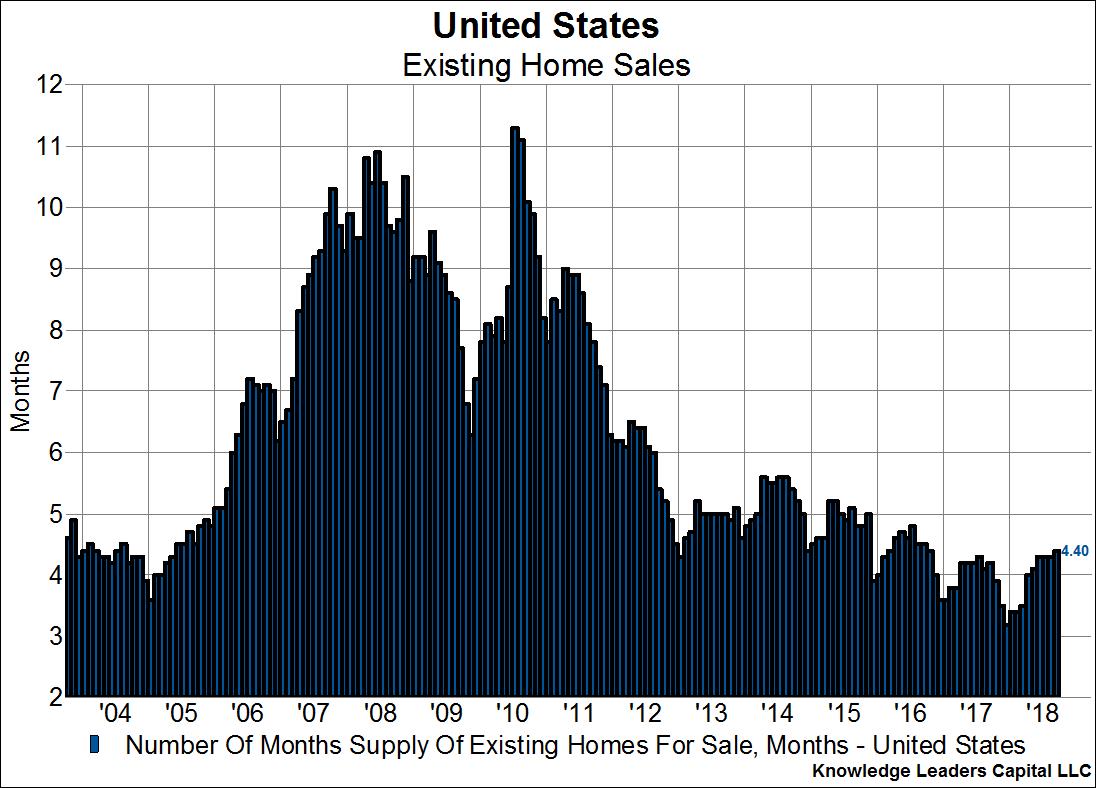
Now, to be fair, the inventory of existing homes for sales is historically low, but the trend of lower inventory levels seems to have ended. Indeed, inventory levels now stand at the highest level since 2016. Furthermore, inventory levels rose in September, a phenomenon that hasn’t occurred since 2007 because the seasonal trend is for home listings to peak in the summer and fall off into the winter.
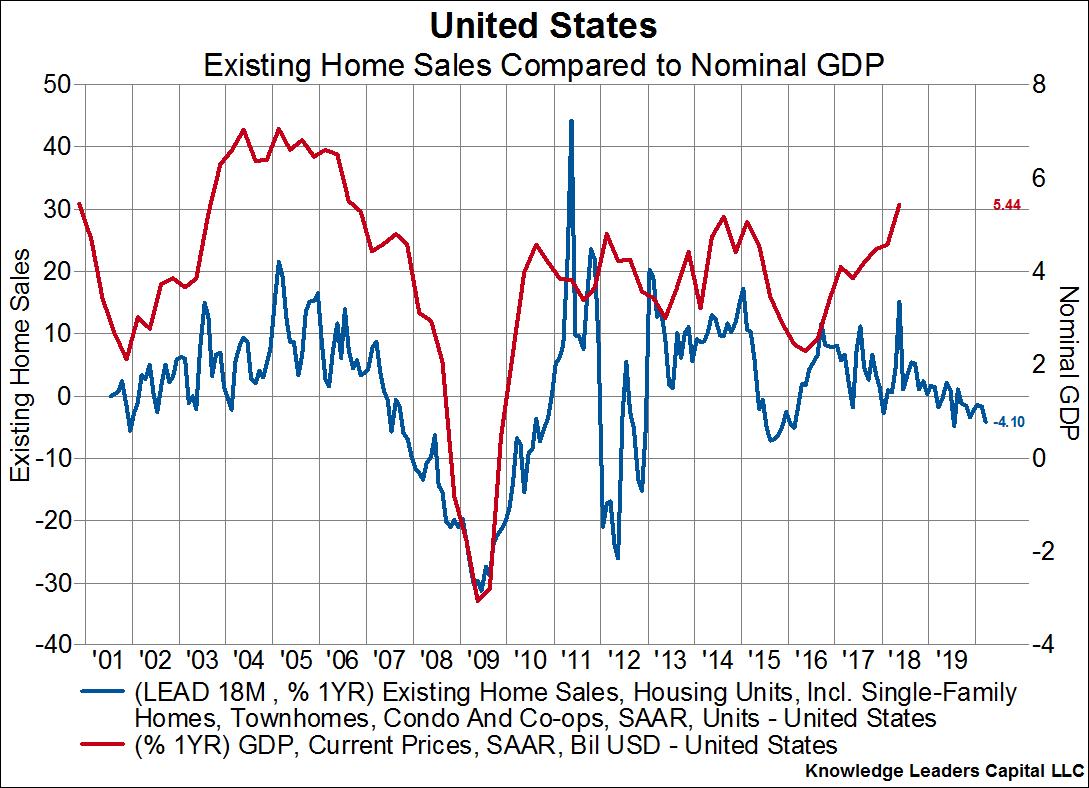
This all matters because the slowdown housing activity leads overall economic activity by eighteen months. Housing, being one the the most cyclically sensitive sectors of the economy, often feels the impact of higher rates well before other areas. This alone implies a peaking of economic activity right about now, leading to persistently slower growth rates through Q1 2020. Not coincidentally, a peaking of economic activity about now is also consistent with the 1.2% fiscal stimulus boost we’re getting in 2018. Incremental stimulus for 2019 drops to .4%, with the potential of that entire stimulus being negated by dead weight losses from tariffs, but that is a topic for another day.