by Chris Kimble
It’s truly amazing how important Fibonacci retracement and extension price levels are… and there’s no better place to highlight them than on a chart!
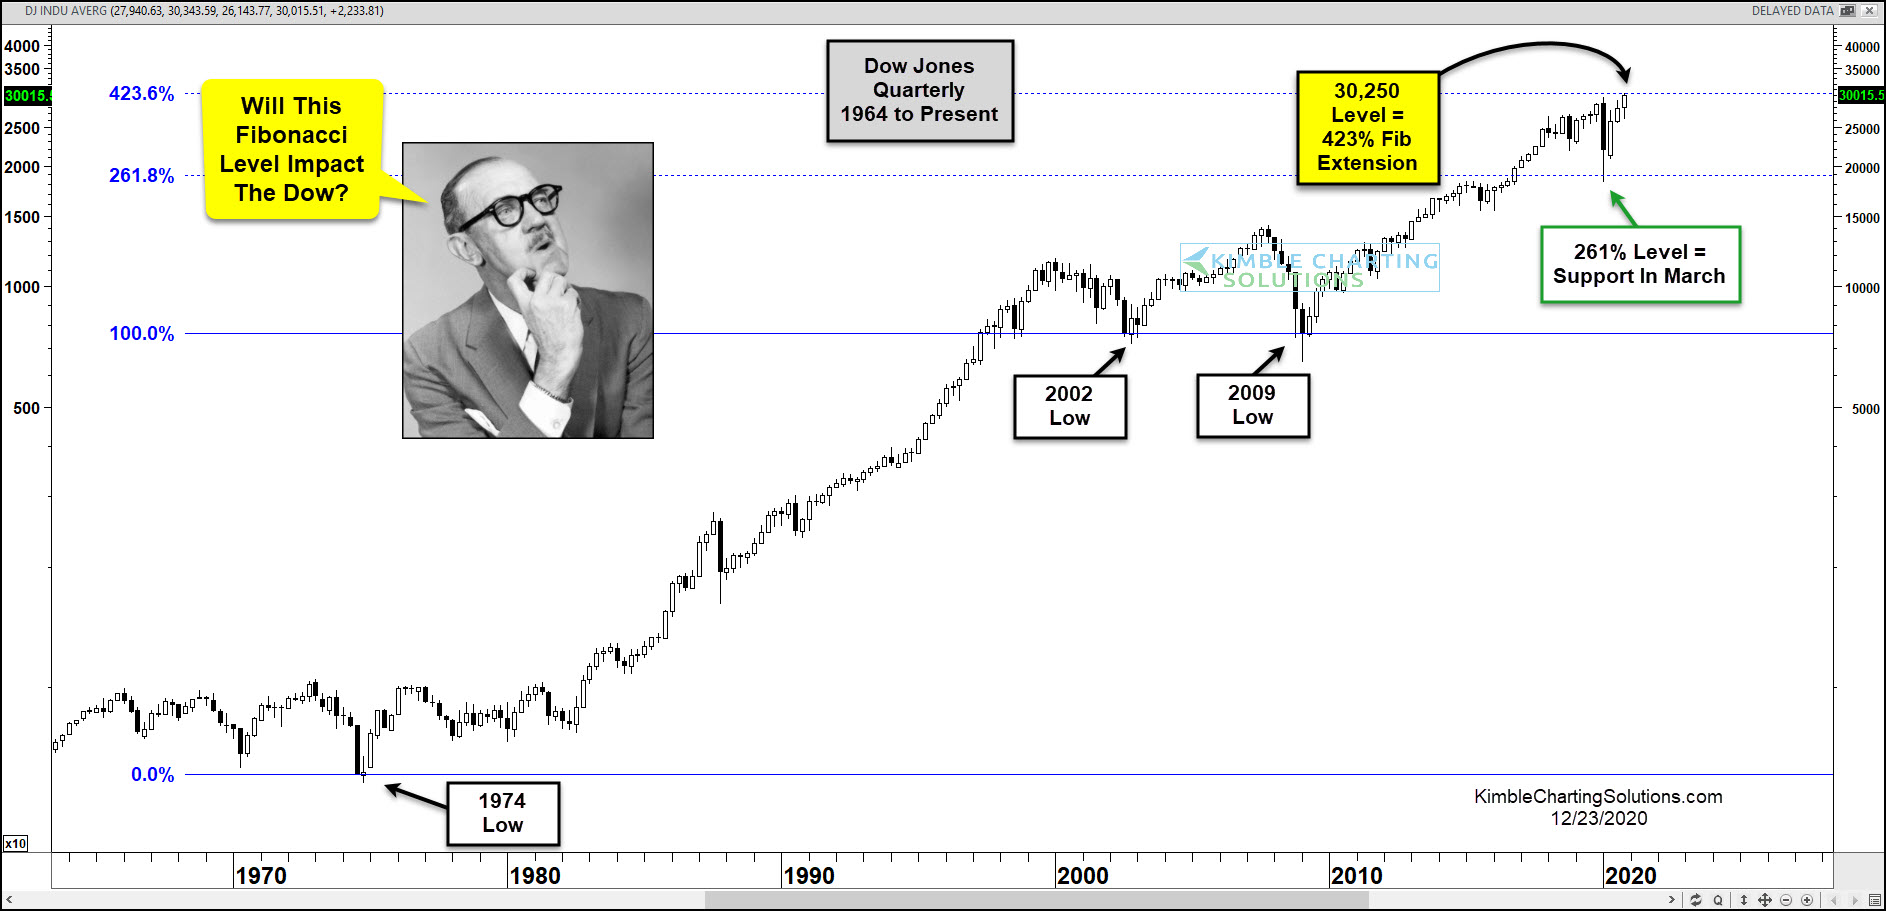
Today we look at a long-term “quarterly” chart of the Dow Jones Industrial Average (since 1964). Using 1974 as a major “quarterly” low and measuring that to the 2002 and 2009 major lows, we can draw out Fibonacci extensions to 261.8% and 423.6% price levels.
Here we can see that the 261.8% price level served as resistance for several quarters before becoming support… support that held as a “low” this past March… perhaps another major low.
From there, the Dow Industrials surged higher and are currently testing another major “quarterly” Fibonacci extension level (the 423.6% Fib) at 30,250.
Will This Fibonacci price level impact the Dow Industrials?
With the trend being up at this time, if the Dow takes out this extension level, price and history would suggest it could rally a large percentage.
This price level should be important for the Bulls and Bears!
This article was first published on See It Markets.com. To see the original post CLICK HERE.