by Chris Kimble

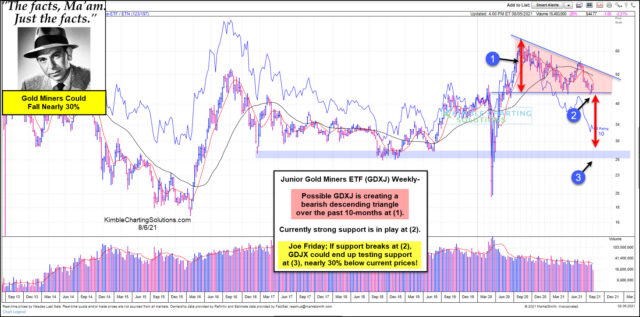
This chart comes from Marketsmith.com, which looks at Junior Gold Miners ETF (GDXJ).
This chart highlights that GDXJ could be creating a bearish descending triangle over the past 10-months at (1).
Currently, GDXJ is testing an important support line at (2).
Joe Friday Just The Facts Ma’am: If support breaks at (2), the measured move suggests that it could fall to test support at (3), which is nearly 30% below current prices.
GDXJ bulls want/need to see support hold at (3)!
Got a news tip or correction? Let us know
If you got something out of this, please chip in to keep this site running, or subscribe to go ad-free.
2 views