via TraderStef
If you’ve ever found yourself regretful for not being better prepared in a challenging predicament, you suddenly realized what prudence meant. There are times for introspection and analysis in any process of preparation, then a time of decision to move forward presents itself without mercy, and being prepared and knowing where you’re going ahead of time is so much better than being a day late.

The End of the Bull Stock Market, Buy Gold – Charles Nenner w/Greg Hunter – Feb. 11

US Launching Crisis Level Spending… “In all the rhetoric over the proposed Trump budget, the Congressional spending bill, and so forth, it is easy to lose track of both the forest and the trees.” – Zero Hedge, Feb. 12


- Stock Market Volatility vs. U.S. Budget Deficits and Debt at a Tipping Point? – Victor Sperandeo, Feb. 2018
- National Debt ‘Unsustainable,’ Intelligence Director Coats says – MarketWatch, Feb. 13
- US economy is an ‘accident waiting to happen,’ says Yale economist Stephen Roach – CNBC, Feb. 13
- Russian banks ready to switch off SWIFT – RT, Feb. 13
- Fresh Dose of Inflation Fails to Cure Dollar’s Deep-Rooted Ills & Deficit Concern – Bloomberg, Feb. 14
- Inflationistas Sound Alarm – CPI jumped 0.5%, but year-over-year the CPI was flat – Mish Shedlock, Feb. 14


- Stagflation: Retail Sales Tumble Just As Inflation Spikes – Zero Hedge, Feb. 14
- Wage Growth? Real Hourly Earnings Are Slowing Notably – Zero Hedge, Feb. 14
- Dollar weakens despite rising bond yields, hits 15-month low vs yen – CNBC, Feb. 14
- Jeb Hensarling rips Fannie Mae’s request for a $3.7 billion ‘bailout’ – Washington Examiner, Feb. 14
- Dalio’s Bridgewater Boosts Gold Holdings in SPDR, IShares – Bloomberg, Feb. 14
- The current “debt ceiling” has been suspended until March 2019 – Investment Research Dynamics, Feb. 15
- There Will Be No Economic Boom – Lance Roberts at Real Investment Advice, Feb. 15
On to the gold charts. As always, to view a larger version of any chart, right-click on it and choose your “view image” option.
Late in the evening of Feb. 13th, I posted an hourly chart on my Twitter feed that showed gold making a move out of its recent downtrend…

The next day, Valentine’s Day, data on inflation came out. As pointed out by Mish’s article and charts, the inflation picture did not really shift historically. Instead, it was the expectation of an accelerated pace of higher prints to come. The bigger news, IMHO, was a sinking feeling across markets due to a growing lack of confidence in the U.S. political system. The national debt TaperCaper is about to go through the roof again while waiting for a tax reform-induced economic recovery to counter the continued lack of a debt ceiling. The expectation is for major economic recovery statistics with runaway inflation before an official recession has a chance to set in. The gold market is a barometer that is not buying the forecast. The initial kneejerk reaction in the gold spot market was one of a quick plunge, where a brief opportunity for commercial shorts to cover with profit appeared before a yuge short squeeze upward took hold. We won’t know how large the squeeze was until the next two Commitment of Traders (COT) reports are published on Feb. 17th & 24th. The volume on the buy side blew out any previous volume levels since the Dec. 2015 bottom, as can be seen on the following 2-hour chart. The one-minute volumes were larger between 1pm & 1:30pm going into the COMEX close, than those which occurred during the early morning spike. It was quite significant and followed the breakout of the recent downtrend.

On the daily, a Valentine’s Day spike retesting the September highs again and created another Cup and Handlepattern within a Cup and Handle that resides within the Inverse Head and Shoulders’ right shoulder (see the weekly chart). So many technical confluences are taking place that it’s becoming difficult to keep track of them all. Take note that a bullish Golden Cross took place way back in April of 2017 that has never busted. The price continues putting in higher highs and higher lows, and during the recent pullback, it never closed below the 50 EMA while chopping on it for five days. A bullish Alligator Tongue set-up on the DMI-ADX is threatening, and the StochRSIhas blown out to the upside. Take note of how significant the Fibonacci levels have acted as support and resistance. Today’s price action printed a Doji candle, which is indicative of indecision. I remain Neutral near-term, without adding any additional positions until $1,380 is decisively breached, and I’m Bullish for the long-term.

The weekly chart is so full of bullish indicators that there is no need to name them all. The DMI-ADX is setting up for a nice Alligator Tongue, the StochRSI is pivoting back to the topside, the 300 SMA has been price-supportive for the last two weeks, all of the EMAs are banding upward, and a few laterals within patterns await to be challenged around $1,380. As noted on the daily, I’m Neutral near-term and Bullish long-term.

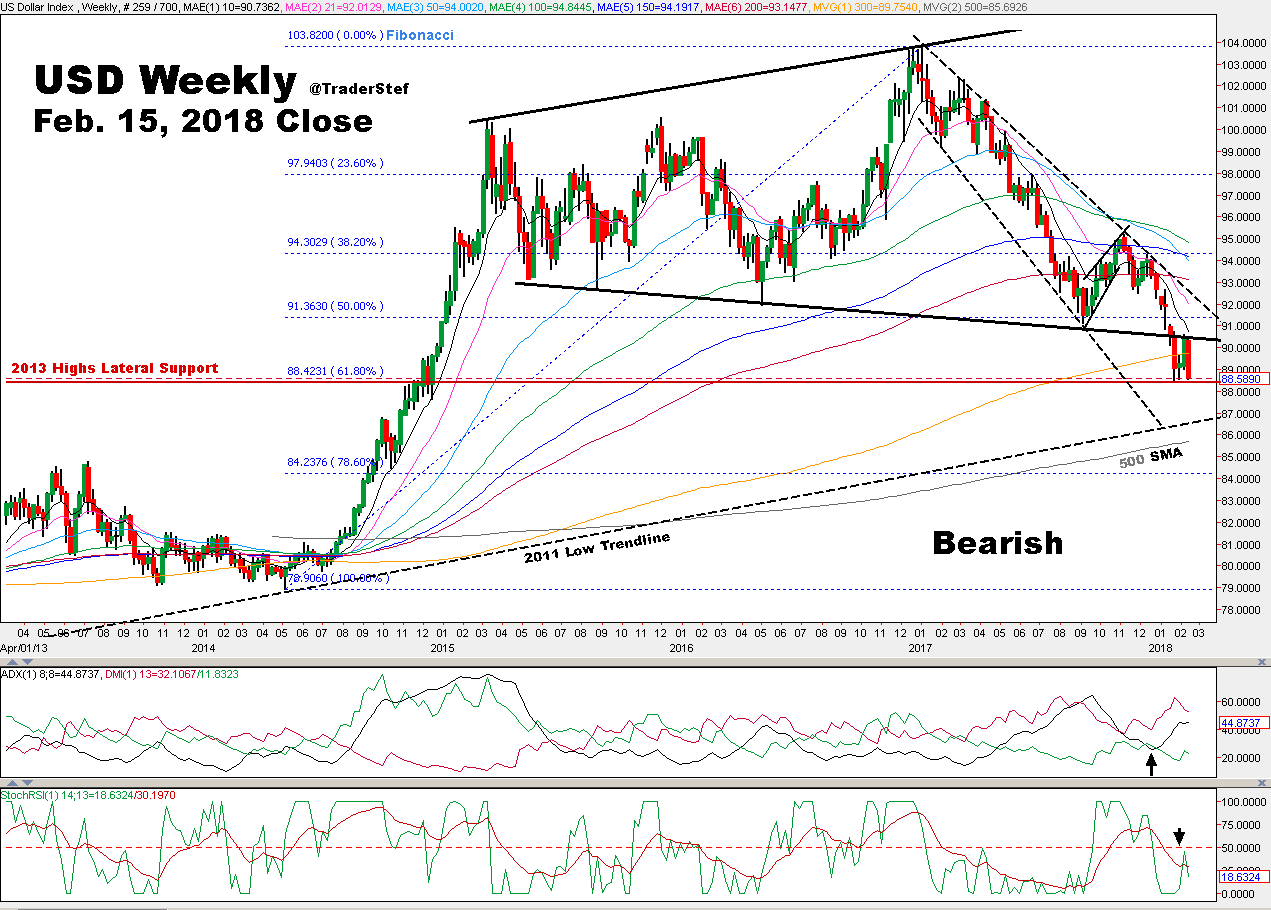
USD continues to be utterly bearish.
JEWS are having a laugh at the expense of the GOYS.JEWs has a stranglehold as they control BANKS, MULTINATIONALS and W govts.
Only DIVINE MERCY can eliminate this entrenchment.