CLICK ON CHART TO ENLARGE
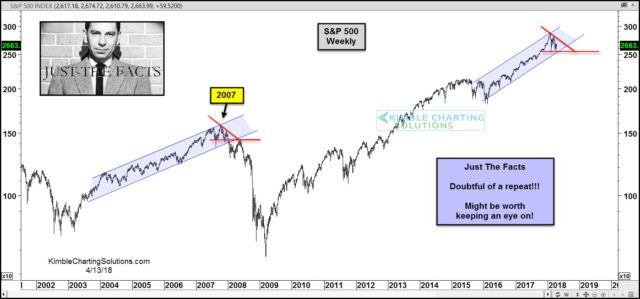
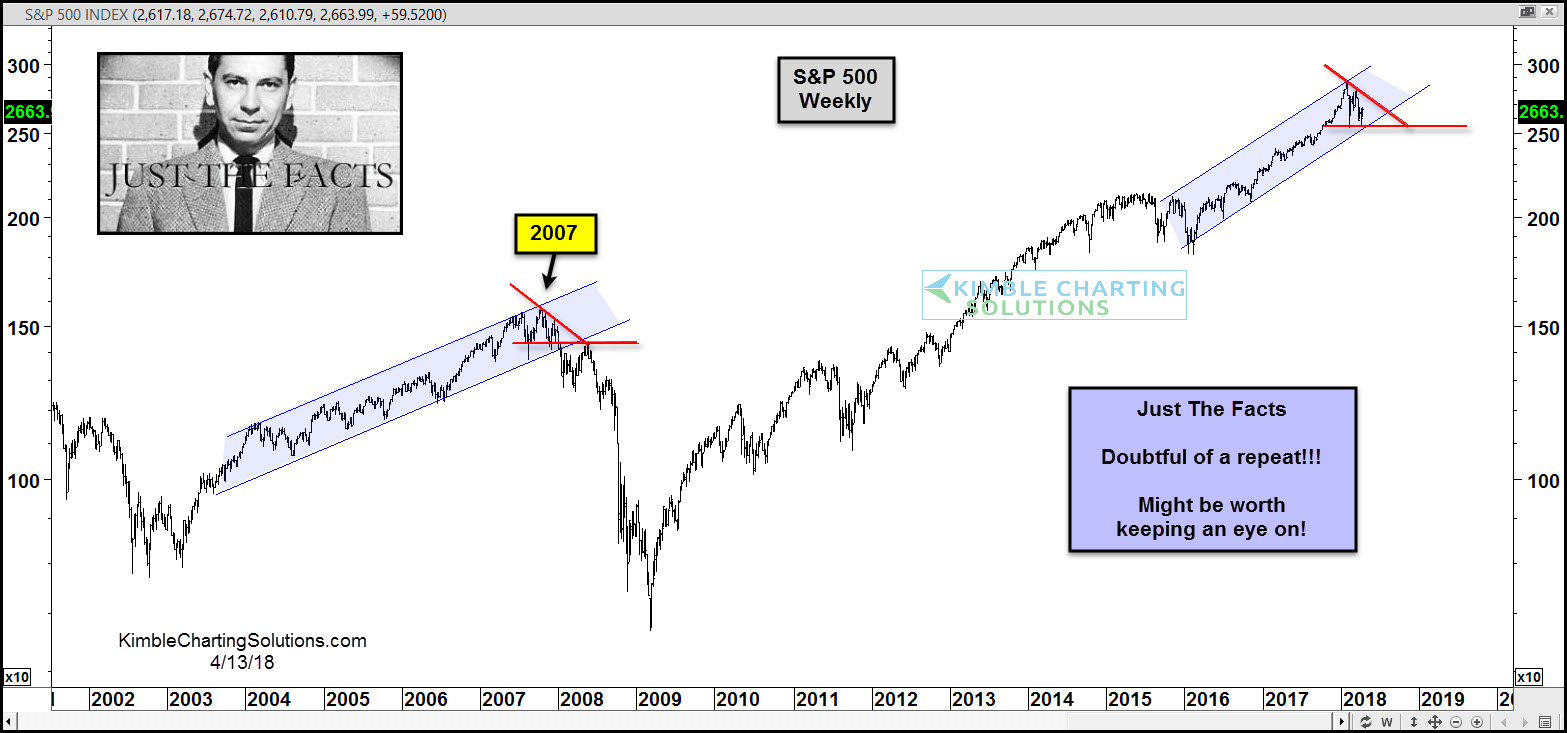
Above looks at the S&P 500 over the past 17-years on a weekly basis.
In 2007 at the top of a rising channel, the S&P 500 appears to have created a “Descending Triangle” pattern before heading lower. Once it broke rising & horizontal support, selling pressure took over.
The S&P over the past couple of months could be creating another descending triangle pattern at the top of its rising channel.
Joe Friday Just The Facts- Doubtful that a repeat is in play!!!
Worth being aware of how important rising & horizontal support could be? Yes!
Got a news tip or correction? Let us know
If you got something out of this, please chip in to keep this site running, or subscribe to go ad-free.
1 view