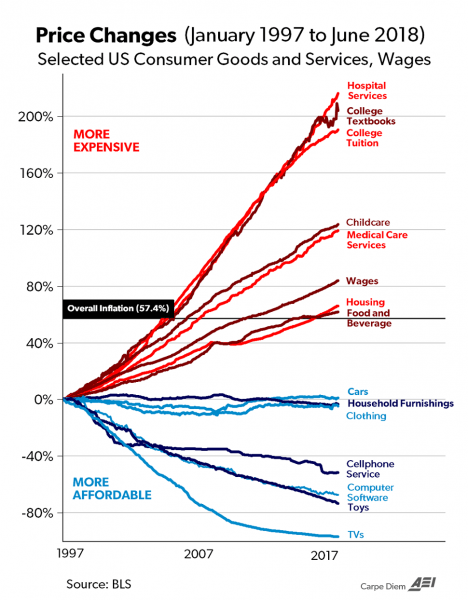
MARK PERRY: “Over the last 12 years, I’ve probably created and posted more than 3,000 graphics on CD, Twitter, and Facebook including charts/graphs, tables, figures, maps and Venn diagrams. Of all of those graphics, I don’t think any single one has ever gotten more attention, links, re-Tweets, re-posts, and mentions than the one above (and previous versions), which has been referred to as ‘the Chart of the Century.’”

Heck, I got a whole book out of it.
h/t GR
Got a news tip or correction? Let us know
If you got something out of this, please chip in to keep this site running, or subscribe to go ad-free.
8 views