Wolf Richter wolfstreet.com, http://www.amazon.com/author/wolfrichter
Women weren’t so lucky either. But who got the spoils?
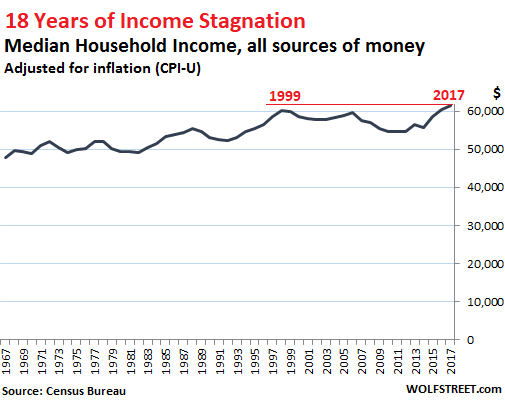
On the surface, the annual household income data released by the Census Bureau today, looks mediocre. But beneath the surface, it looks grim – grim for whom? Ha, we’ll get to that.
So the mediocre news right up front:
Median household income in 2017, adjusted for inflation (via CPI), inched up a measly 1.8% to $61,372. “Household income” is the entire pre-tax “money income” of a household, including wages, interest, dividends, Social Security, Workers Comp, child support, and the like, but excluding capital gains. The mediocre news is that median household income has finally inched above where it had been 18 years ago, in 1999:
Now the grim news: bitter reality for men:
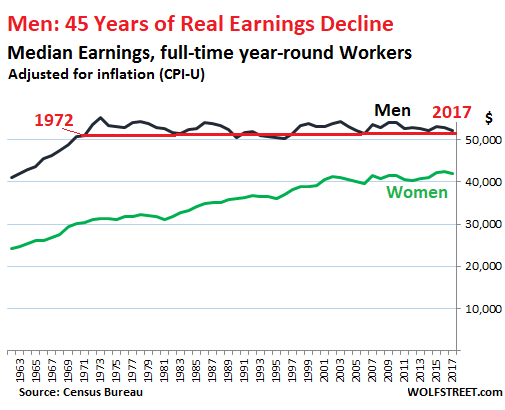
But it’s not great for women either: For women who were working full-time year-round in 2017, median wages (income obtained only from working) declined 1.1% on an inflation-adjusted basis to $41,977 – from a record in 2016 of $42,448.
So a hiccup perhaps in a well-deserved series of increases going back to 1960. The female-to-male earnings ratio remained at the record level of 80.5%, first achieved in 2016, up from the 60%-range before 1982.
But for men – oh dude! Median real earnings for men who worked full-time year-round fell a full 3.0% in 2017 to $52,146. On an inflation-adjusted basis, men had earned more than that in 1972 ($53,609). This translates into 45 years of real-earnings decline for men:
Men have suffered the brunt of the real-wage repression over the past four decades, obtained in part via inflation, an insidious process where wages inch up, but not quite enough to keep up with the Fed-engineered loss of purchasing power of the dollar – a process Wall Street economists praise with conviction.
In addition, even a slight but systematic and purposeful miscalculation of inflation, for example a percentage point or less each year, is cumulative; and over the span of four decades, the real-real earnings decline is large. Wonder why many men are frustrated?
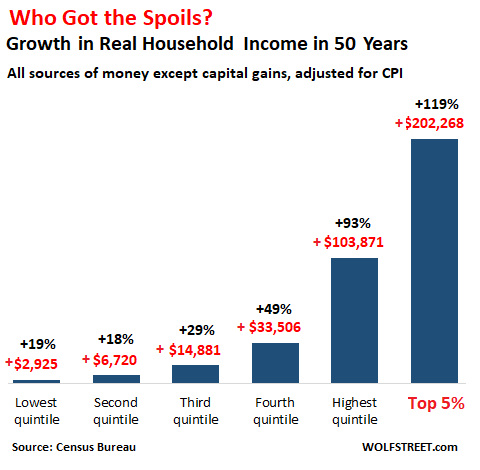
So who got the spoils?
“Earnings” in this data set are the fruits of labor – so wages, salaries, and the like. But “household income” includes “money income” from other sources:
- Earnings
- Unemployment compensation
- Workers’ compensation
- Social security
- Supplemental security income
- Public assistance
- Veterans’ payments
- Survivor benefits
- Disability benefits
- Pension or retirement income
- Interest
- Dividends
- Rents, royalties, and estates and trusts
- Educational assistance
- Alimony
- Child support
- Financial assistance from outside of the household
- Other income
“Household income” is measured on a pre-tax basis. But it does not include noncash benefits, such as food stamps, subsidized housing benefits, or healthcare benefits — a hefty amount for executives at big companies.
While household income includes income from investment (items 10, 11, 12, and 13 in the list above), it does not include capital gains and other forms of capital appreciation of any kind, from portfolio gains and home-price appreciation to stock options.
In terms of the income distribution, the proceeds from investment (items 10, 11, 12, and 13 in the list above) play a critical role at the upper end. Again, this income does not include capital gains! This is how the median household income, pre-tax and adjusted for inflation, has grown by income segment (quintiles) and for the top 5%:
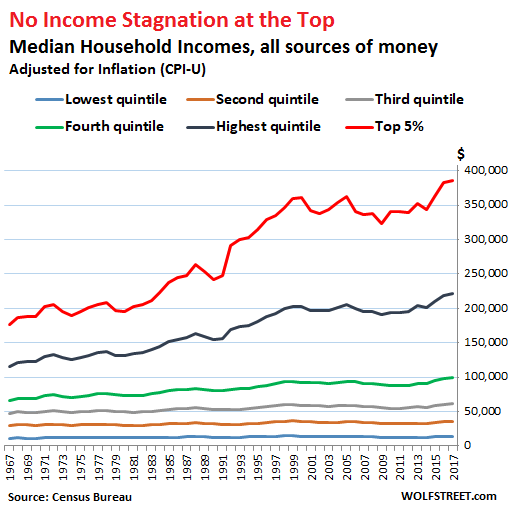
The inflation-adjusted household income of the top 5% (red line) has soared by $202,000 (119%) since 1967, to reach $385,289 in 2017 (not including capital gains). Compare this to the bottom 60% of households (three lines at the bottom), whose incomes have booked tiny gains. The bottom 20%, with a mean of $13,258 in 2017, gained just $2,925, or 19%, over the past 50 years:
This phenomenon of disproportionate income gains at the top doesn’t even include capital gains, which would skew the chart into the stratosphere, thanks in part to the Fed’s QE and zero-interest rate policy (now finally on the way out) to accomplish what Ben Bernanke called the “wealth effect.” He explained it to Americans in an editorial in 2010 in the Washington Post. The explicit purpose was to make the wealthy – who already had the most assets – wealthier so that they’d feel more confident in their genius and more satisfied with their lives after the heavy losses they took during the Financial Crisis, in the hope that they’d spend a little more. The first part worked: The wealth effect created the Everything Bubble. But if these capital gains were included, the chart would look truly absurd.
However, for the bottom quintile on the income scale, their real household income has dropped 8.6% since 1999.
On second thought, Mr. Bernanke, strangling the real incomes of the 60% or 80% of households that spend nearly every dime they make and on whom the economy relies for growth, while enriching some households at the top that don’t even spend their gains — well, this may not have been the most effective economic model over the longer term, no?
But the Fed has now changed its tune. QE is getting unwound and interest rates are rising. Read… Markets Increasingly Sure: 4 Rate Hikes in 2018