- Clinging To Support
- Tops Are Processes – A Review
- Actions To Take Next Week
- Sector & Market Analysis
- 401k Plan Manager
Follow Us On: Twitter, Facebook, Linked-In, Sound Cloud, Seeking Alpha

Clinging To Support
Over the last couple of weeks, as interest rates surged above 3%, we explored the question of whether something had “just broken” in the market.
This is an important question given the current stance by the Fed appears to be considerably hawkish as noted by the recent minutes:
A Number of Officials Saw Need to Hike Above Long-Run Level
“A few participants expected that policy would need to become modestly restrictive for a time and a number judged that it would be necessary to temporarily raise the federal funds rate above their assessments of its longer-run level.”
The Fed is worried about asset bubbles…
“Some participants commented about the continued growth in leveraged loans, the loosening of terms and standards on these loans, or the growth of this activity in the nonbank sector as reasons to remain mindful of vulnerabilities and possible risks to financial stability.”
In other words, the Fed is “gonna hike until something breaks” and it will likely break in a credit related area like junk bonds, covenant-light, and leveraged loans.
Important note: It won’t be one, or another, but all of them at once when “something breaks.”
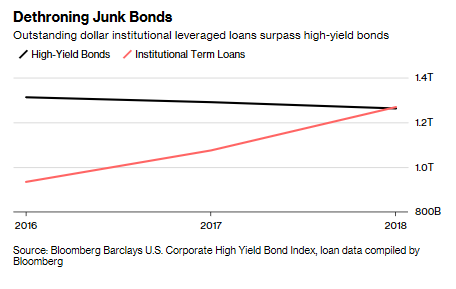
As noted by Bloomberg:
“The total of outstanding U.S. dollar leveraged loans has hit $1.27 trillion, according to data compiled by Bloomberg, overtaking high-yield bonds in the past week to cement their status as the go-to financing source for speculative-grade companies. October is on course for the highest issuance since June, while junk bond sales are the slowest since 2009.”
“For regulators at the BIS — sometimes called the central bank for central banks — a boom in leveraged loans often presages a bust in the wider economy. The market is ‘particularly procyclical,’ according to the report, and it rose faster than high-yield bonds in the run-up to the global financial crisis.”
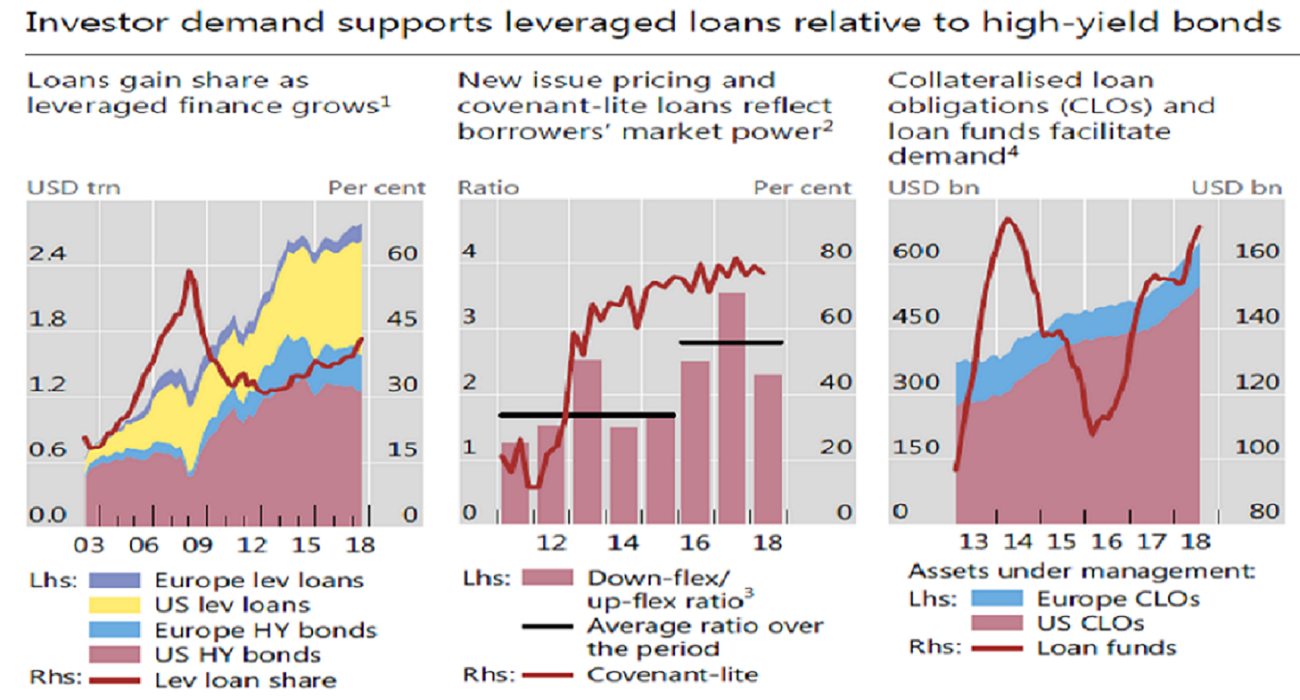
With substantially weaker loan documentation, accelerating demand for CLO’s (collateralized loan obligations), and a proliferation of covenant-lite loans, the risk to the next “financial crisis” has risen markedly given the massive surge in debt due to an extended period of ultra-low interest rates.
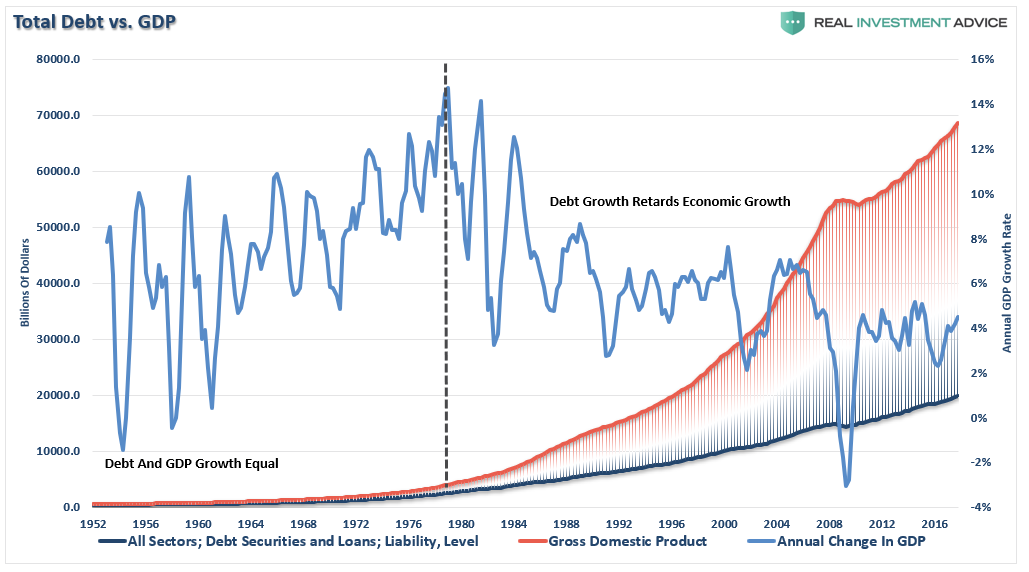
Of course, with the Fed hiking interest rates, which is pushing debt servicing costs higher, it is only a function of time until the rate of change in interest rates causes a financial decoupling in heavily levered companies with marginal balance sheets and debt servicing capacity.

Pay attention to the warnings the credit market is sending.
Clinging To Support
The market may already be sniffing out an impending problem. I noted last week that if interest “rates remain above 3%, stocks are going to continue to struggle.”
This past week has been a decidedly tough struggle for stocks to pick themselves up after last week’s drubbing. While we saw a sharp reflexive bounce earlier this week, that bounce quickly faded as stocks returned to retest support at critically important levels.
The chart below is the updated “pathway” chart from last week. I have only updated the price on the chart again this week but did NOT change any of the previously detailed paths set out last week.
Chart updated through Friday – pathways remain unchanged
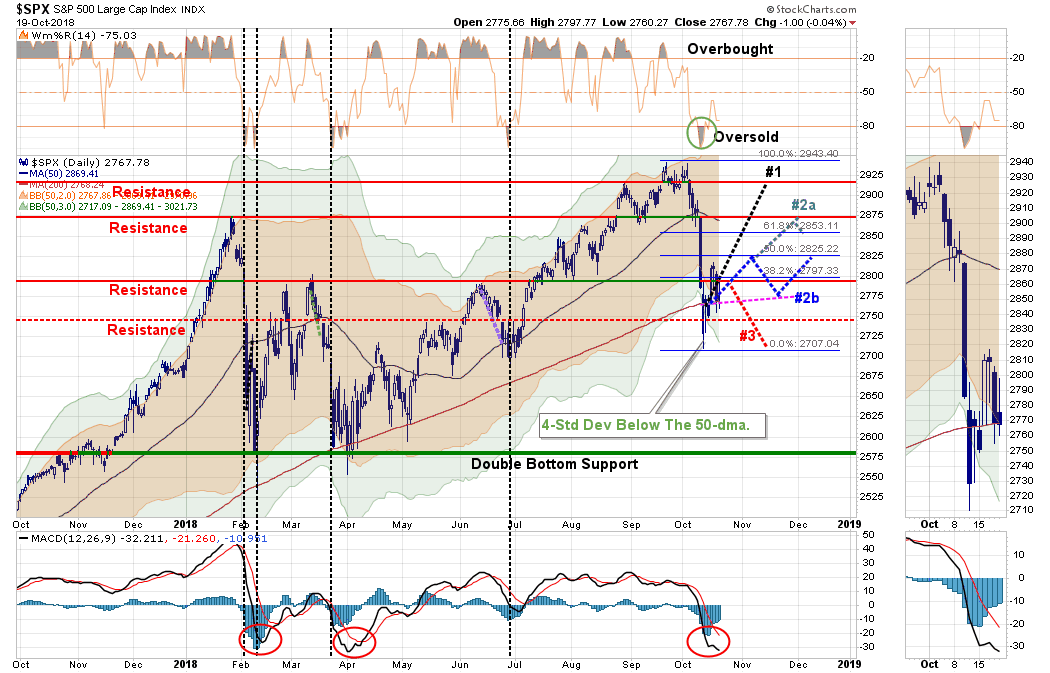
As I wrote, no matter how many different paths I trace out, the possibilities of the market rallying back to new all-time highs this year have been greatly reduced. Therefore, all four possibilities continue to suggest a broader topping pattern in place through the end of this year.
The good news, if you want to call it that, is the market DID hold the 200-dma for the week. With the market deeply oversold currently, we still expect a bounce going into next week. This bounce could well be supported by the end of the “blackout” period for companies to buy back their own shares.
Also, note that back in early February we saw a similar short-term bottoming process where the initial bounce failed then bounced in mid-March before failing again to retest the February lows.
My suspicion is that we will likely see much of the same action over the next month or so. Currently, pathway #2a and #2b are still the most likely outcomes currently and should be used to “sell into” to raise capital, deploy portfolio hedges, raise stop levels, and reduce risk.
Pathway #2a: The market rallies from current levels to the January high. Again, this would likely be fueled by a stronger than expected earnings season and a pickup in economic activity. However, the run to the January highs is capped by that resistance but the market finds support at the 62% Fibonacci retracement level just below. (30%)
Pathway #2b: The most feasible rally from current oversold levels is back to the 50% Fibonacci retracement of the recent decline. The market gets back to very overbought conditions and the market begins to trade between the 200-dma and/or the 32% Fibonacci retracement level. (30%)
However, the risk of Pathway #3 becoming a reality has also risen markedly during this past week. But given the deep short-term oversold condition, we are due for a fairly strong bounce first.
With the understanding the economic and fundamental background may not be supportive for higher asset prices heading into 2019, it is important to note the market is sending a very different technical signal this time. As discussed last week, this is the FIRST time the market has broken the bullish trend line that began in 2016.
Importantly, the market surge last week tested, and failed, at the previous rising bullish trend line. While the market is still holding important support this past week, the deterioration in momentum is warning of a potentially larger correction process in the making.
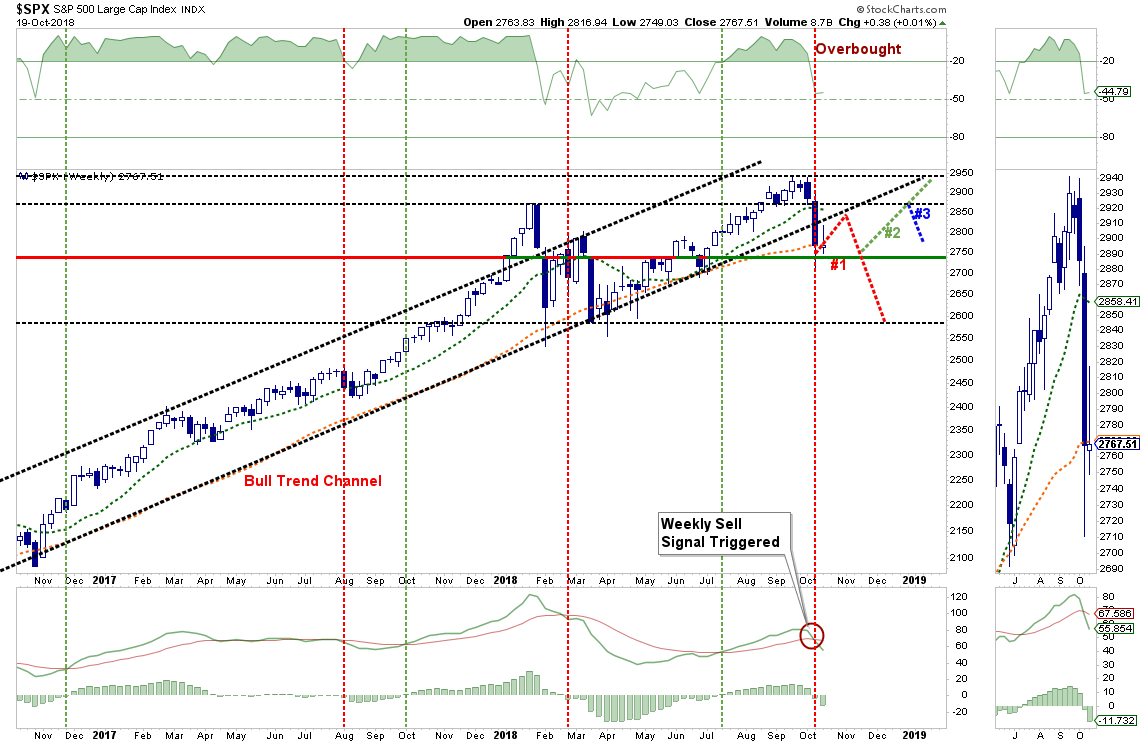
With an early “sell signal” intact, the warnings to reduce portfolio risk could not be more prevalent.
Actions To Take Next Week
With the market still 3-standard deviations below the 50-dma and very oversold technically, we still suspect a fairly strong bounce to sell into next week. Portfolio management processes should be switched from “buying dips” to “selling rallies” until the technical backdrop changes.
The actions remain the same as this past week and the actions we will specifically be taking on a rally.
- Re-evaluating overall portfolio exposures. It is highly likely that equity allocations have gotten out of tolerance from the original allocation models. We will also look to reduce overall allocation models from 60/40 to 50/50 or less.
- Look to add bond exposure to mitigate volatility risk. (Read: The Upcoming Bond Bull Market)
- Use rallies to raise cash as needed. (Cash is a risk-free portfolio hedge)
- Review all positions (Sell losers/trim winners)
- Look for opportunities in other markets (Gold may finally shine)
- Add hedges to portfolios (If the market begins to show a negative trend we will add short positions)
- Trade opportunistically (There are always rotations that can be taken advantage of)
- Drastically tighten up stop losses. (We had previously given stop losses a bit of leeway as long as the bull market trend was intact. Such is no longer the case.)
If I am right, the conservative stance and hedges in portfolios will protect capital in the short-term. The reduced volatility allows for a logical approach to further adjustments as the correction becomes more apparent. (The goal is not to be forced into a “panic selling” situation.)
If I am wrong, and the bull market resumes, we simply remove hedges, and reallocate equity exposure.
As investors, we have to prepare for the storm BEFORE it hits, and there are definitely storm clouds on the horizon. This was a point J.C. Parets noted last week:
“In my opinion, we are in a stock market environment where a crash is entirely possible. Now, just because it is possible doesn’t mean it will come. I think of it like the city of Miami, where I grew up, during hurricane season. Just because it’s the season doesn’t guarantee that a storm will come, but it is absolutely the time to be aware that one can show up and destroy your home or even kill you if you’re not prepared.
Hurricanes don’t hit Miami in February and stock market crashes aren’t sparked from all-time highs. It’s more of a process. The thing is, the ingredients for a market crash are absolutely starting to appear”
Tops are a process and my friend Doug Kass had an excellent piece on this issue last week.
Tops Are Processes – A Review
by Doug Kass
“Tops are a process, bottoms are an event.” –Wall Street adage
Tops are a process and bottoms are an event, at least most of the time in the stock market. If you looked at an ice cream cone’s profile, the top is generally rounded and the bottom V-shaped. That is how tops and bottoms often look in the stock market, and I believe that the market is forming such a top now.
The catalysts for a market top are multiple, some of which I detailed in last Monday’s two-part series, “Investors Are No Longer Being Compensated for Taking Risk.” Consider the following:
* Downside Risk Dwarfs Upside Reward. I base my expected market view on the probabilities associated with five separate (from pessimistic to optimistic) projected outcomes that seize on a forecast of economic and corporate profit growth, inflation, interest rates and valuation.
* Global Growth Is Less Synchronized . The trajectory of worldwide growth is becoming more ambiguous. I have chronicled extensively the erosion in soft and hard high-frequency data in the U.S., Europe, China and elsewhere, so I won’t clutter this missive with too many charts. But needless to say (and as shown by these charts here and here), with economic surprises moderating from a year ago and in the case of Europe falling to two-year lows, we are likely at “Peak Global Growth” now. (The data are even worse in South Korea, Taiwan, Indonesia and Thailand.)
* FAANG’s Dominance Represents an Ever-Present Risk. Last Monday I warned that earnings disappointments in the FANG stocks represents an immediate risk to this league-leading sector, and to the markets FANG has become GA!
* Market Structure Is One-Sided and Worrisome. Machines and algos rule the day; they, too, are momentum-based on the same side of the boat. The reality that “buyers live higher and sellers live lower” represents the potentially dangerous condition that investors face in a market dominated by passive investors.
* Higher Interest Rates Not Only Produce a More Attractive Risk-Free Rate of Return, They Also Make It Hard for the Private and Public Sectors to Service Debt
* Trade Tensions With China Are Intensifying and Mr. Market Is Improperly Looking Past Marginal Risks. From Goldman Sachs’ David Kostin (h/t Zero Hedge). Remember, as discussed within this column, the dispute has buoyed second-quarter U.S. GDP. The “benefit” soon will be over and a second-quarter economic cliff is possible.
* Any Semblance of Fiscal Responsibility Has Been Thrown Out the Window by Both Political Parties. This has very adverse ramifications (which shortly may be discounted in lower stock prices), especially as it relates to the servicing of debt — a subject I have written about often. Not only are our legislators acting irresponsibly and recklessly, but the Republican Party is now considering more permanent tax cuts. Should economic growth moderate, tax receipts diminish and undisciplined spending continue, stock valuations will likely continue to contract.
* Peak Buybacks. Buybacks continue apace, but look who’s selling. As Grandma Koufax used to say, “Dougie, that’s quite a racket!” If I am correct about the peaking in corporate profits, higher interest rates and slowing economic growth, we shortly will have another rate of change — negative in buybacks.
* China, Europe and the Emerging Market Economic Data All Signal a Slowdown. It’s in the early innings of such a slowdown based on any real-time analysis of the economic data. The rate-of-change slowdown on a trending basis is as clear as day. A rising U.S. dollar and weakening emerging-market economic growth sow the seeds of a possible U.S. dollar funding crisis.
* We Are Moving Closer to the November Elections, With Their Uncertainty of Outcome and the Potential For a “Blue Wave.” The current 40% approval rating for the president is historically a losing proposition for the incumbents. We also may be moving toward some conclusion of the Mueller investigation — is the Summer of 2018 the Summer of 1974?
Bottom Line
“Confronted with a challenge to distill the secret of sound investment into three words, we venture the motto, Margin of Safety.” —Benjamin Graham
The search for value and comparing it to risk taken is, at its core, the marriage of a contrarian streak and a calculator.
While it is important to gauge the possibility that the market may be making an important top, it is even more important to distill, based on reasonable fundamental input, what the market’s reward vs. risk is. This calculus trumps everything else that I do in determining market value.
On that front, I continue to believe that downside risk dwarfs upside reward.
Moreover, there is a growing fundamental and technical list of signposts that may suggest that the market is starting to look like it is in the process of making a possible (and important) top.
As Joel Greenblatt wrote:
“There’s a virtuous cycle when people have to defend challenges to their ideas. Any gaps in thinking or analysis become clear pretty quickly when smart people ask good, logical questions. You can’t be a good value investor without being an independent thinker – you’re seeing valuations that the market is not appreciating. But it’s critical that you understand why the market isn’t seeing the value you do. The back and forth that goes on in the investment process helps you get at that.”
See you next week.
Market & Sector Analysis
Data Analysis Of The Market & Sectors For Traders
S&P 500 Tear Sheet
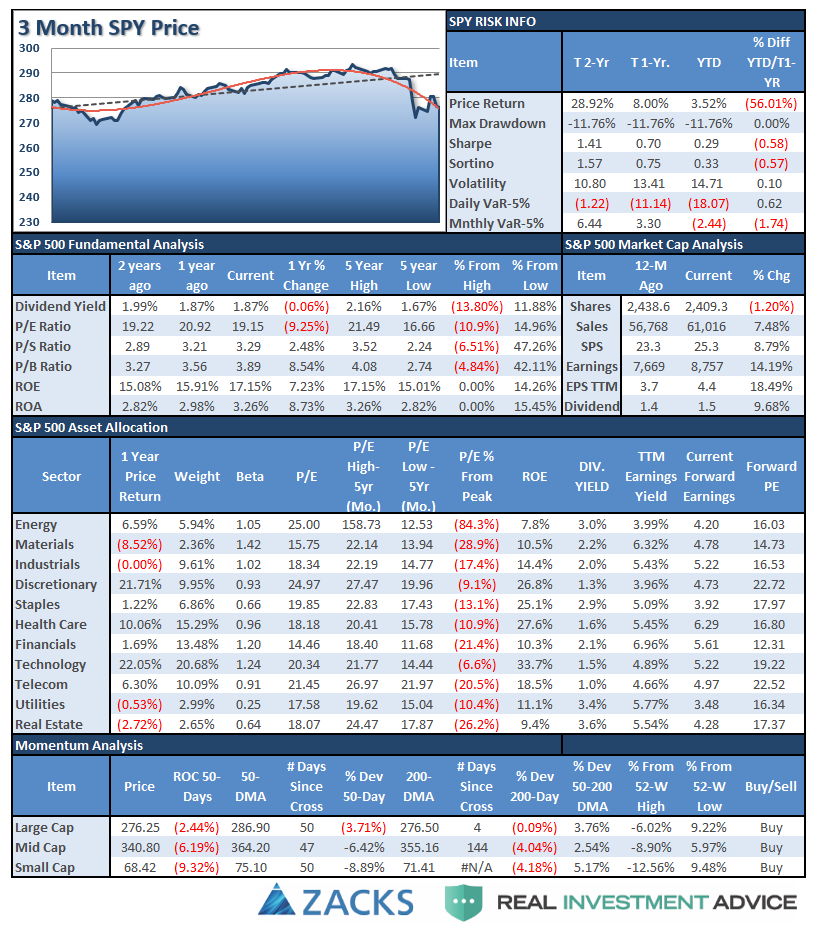
Performance Analysis
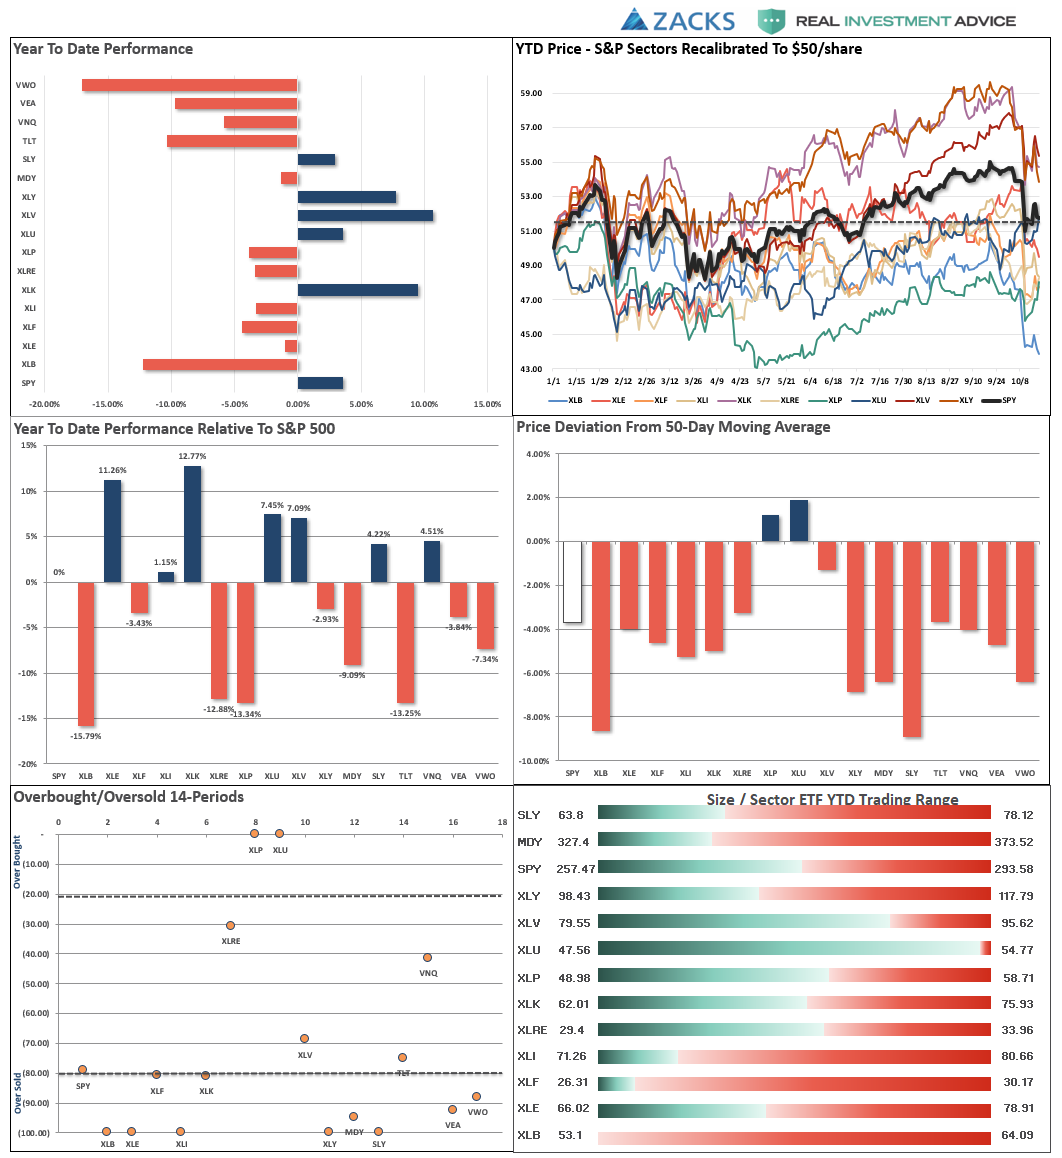
ETF Model Relative Performance Analysis
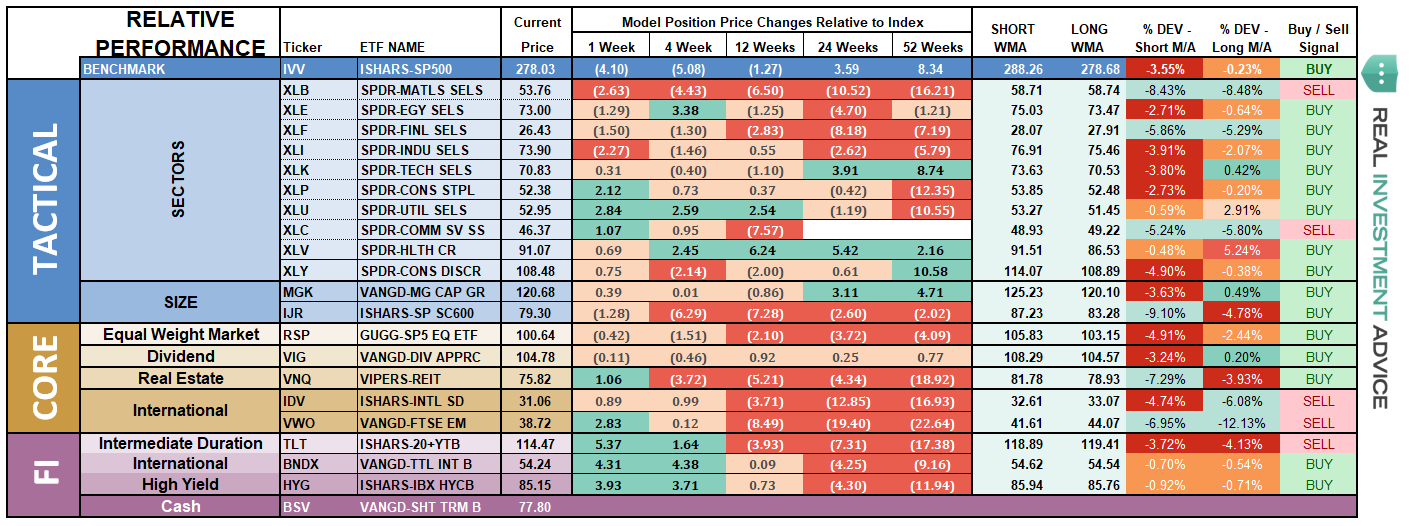
Sector & Market Analysis:
Sector-by-Sector
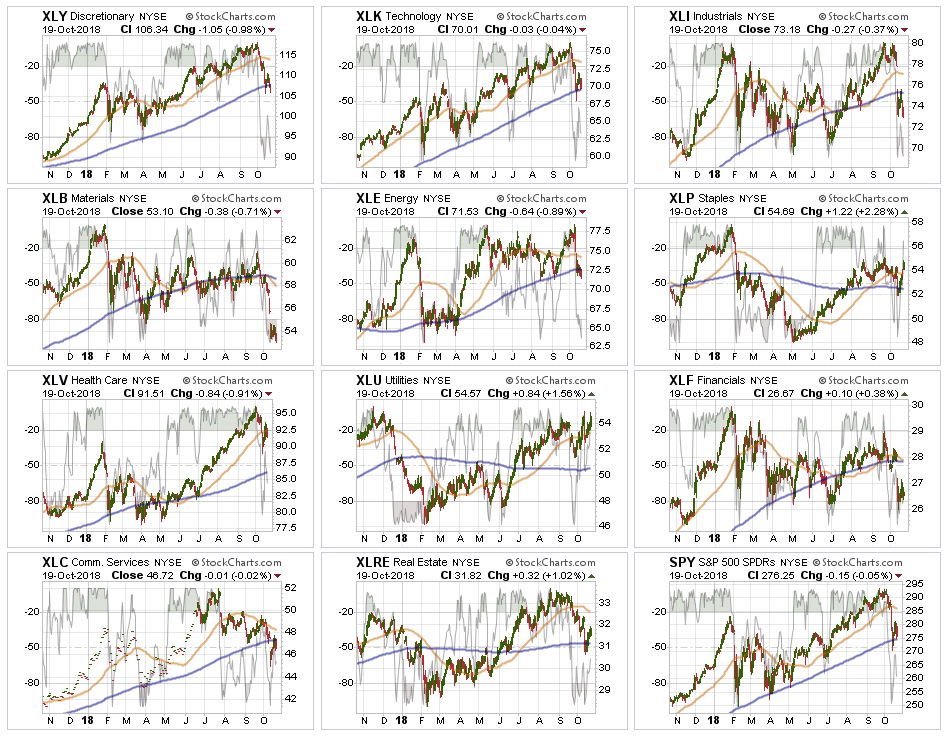
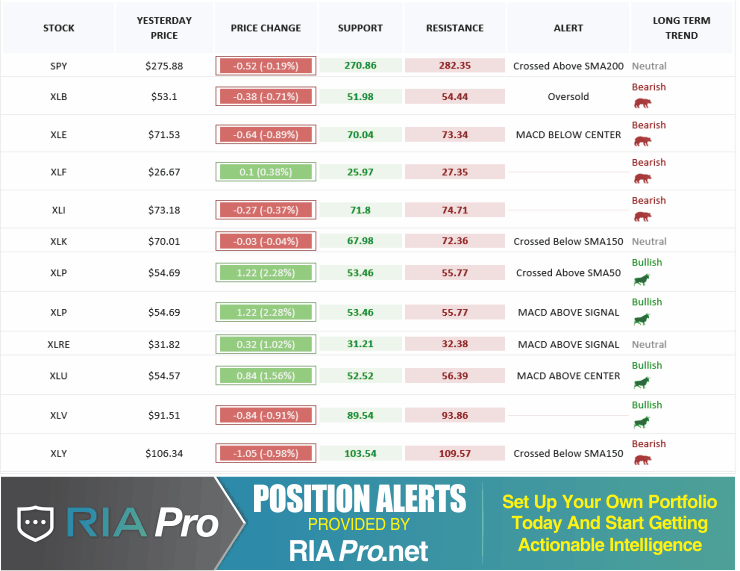
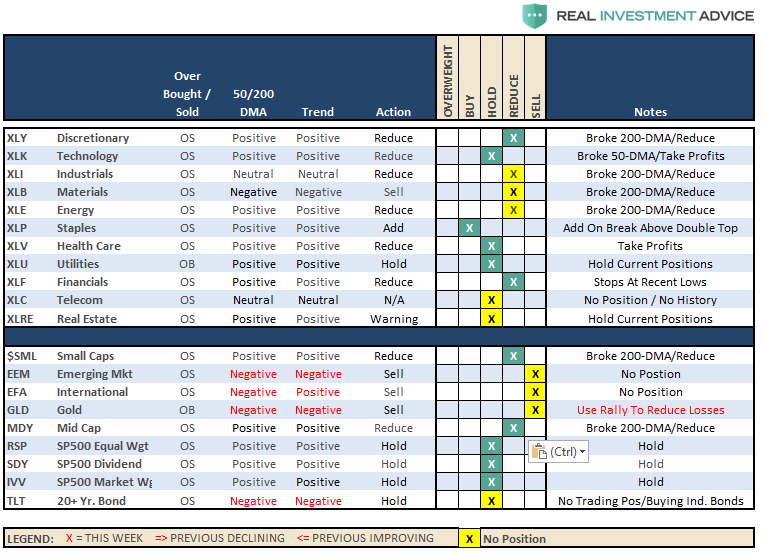
Discretionary, Industrials, Materials, Staples, Energy, and Financials have all violated their 200-dma and failed to recover. Financials are particularly troubling given the decent fundamental backdrop for banks currently. These sectors are now in “sell rallies” mode until there is a resumption of a more bullish trend. Basic Materials violated its April lows and all previous stop levels. This sector should be sold on any rally in the coming days. Industrials also failed a rally to its 200-dma confirming a sell for the sector. Energy is now a sell after failing at a double-top and then breaking the 200-dma.
Real Estate, Healthcare, and Technology have held their 200-dma support during the recent rout. Technology is hanging on to that support along with the overall market. Real Estate rallied last week back above the 200-dma and off of previous support, however, the downtrend is still negative at the moment. Healthcare, after recommending to take some profits, broke below its 50-dma on big volume. Continue to rebalance risk in portfolios.
Staples & Utilities – the rotation to safety trade, despite higher rates, is evident in both of these sectors. Staples, after a successful test of the 200-dma surged back above the 50-dma last week. The sector is about to test a triple-top but a break above that level will put it on a momentum buy signal for portfolios. Utilities broke out to all-time highs last week also putting the sector on a momentum buy.
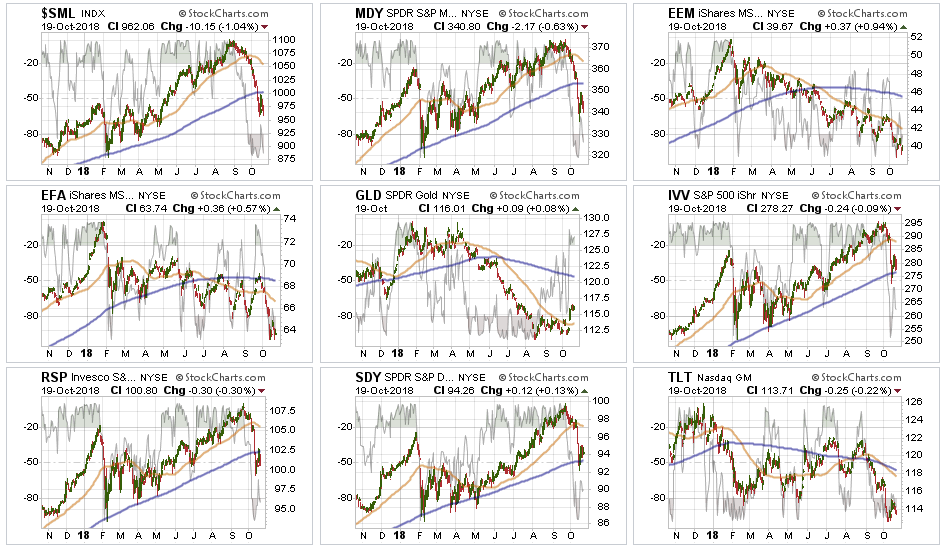
Small-Cap and Mid Cap – the breakdown in small and mid-cap stocks suggest a broader change to the overall market complexion. Last week, both markets violated their 200-dma and their bullish trend lines from February of this year. Last week, both indices failed a test of the 200-dma and are threatening to break recent lows. Sell any rally and put a stop at recent lows.
Emerging and International Markets this past week, both markets retested their lows. There still remains, since we recommended selling in January of this year, no reason to be long these sectors just yet. If we start to see real improvement, versus a bounce in a downtrend, we will reconsider our weightings.
Dividends, Market, and Equal Weight – The overall market dynamic appears to have changed last week. With the markets deeply oversold short-term look for a rally to reduce risk, rebalance weightings in portfolios, and raise some cash.
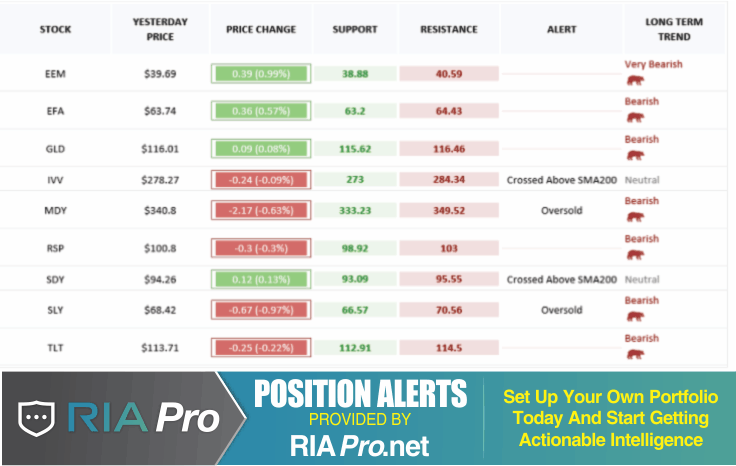
Gold – as I noted last week:
“After repeated failures at the 50-dma, the metal finally found some life in the midst of the recent market meltdown. With Gold now extremely overbought short-term, use this rally to sell holdings if you are deeply underwater. From a trading perspective, IF, and this is a big if, Gold can hold the 50-dma on a pullback and turn higher, a rally to the 200-dma is feasible. Such would coincide with a much bigger sell-off in stocks.”
Bonds – broke their near-term support at $114 triggering the stop loss on trading positions. However, we are now aggressively buying individual bonds at depressed prices and increasing yield in portfolios. All trading positions are currently closed.
The table below shows thoughts on specific actions related to the current market environment.
(These are not recommendations or solicitations to take any action. This is for informational purposes only related to market extremes and contrarian positioning within portfolios. Use at your own risk and peril.)
Portfolio/Client Update:
The rally we were wanting to use to reduce risk into last week – last one day. This is not a good sign, and is something that has raised our “caution” levels markedly.
However, despite the volatility of last week’s action, the market DID NOT violate the 200-dma and, therefore, remains a correction within a bull market for now.
The market remains deeply oversold on a short-term basis and we continue to expect a rally this week in which we can reduce equity risk accordingly.
Please review the “Checklist Summary Of Actions To Take” in the main missive above. We will be applying this rules to our portfolios as well.
- New clients: We are holding OFF on-boarding into our portfolio models until a better risk/reward opportunity emerges.
- Equity Model: All positions are being reviewed and positions that have violated stop levels will be sold to reduce portfolio risk.
- Equity/ETF blended – Same as with the equity model.
- ETF Model: We will reduce small and mid-cap holdings on any rally back toward the 50-dma.
- Option-Wrapped Equity Model – If the market rallies back to previous resistance levels, we will add a long-dated S&P 5oo put option to portfolios to hedge risk.
As we have repeatedly stated, we are well aware of the present risk. However, these violent declines are symptomatic of the liquidity issues posed by the massive surge in passive indexing.
As we have stated previously:
“This is why we ‘step’ into positions initially. Once a ‘trade’ begins to work as anticipated, it is then brought to the appropriate portfolio weight and becomes a long-term investment. We will unwind these actions either by reducing, selling, or hedging, if the market environment changes for the worse.”
This past week, it did.
THE REAL 401k PLAN MANAGER
The Real 401k Plan Manager – A Conservative Strategy For Long-Term Investors
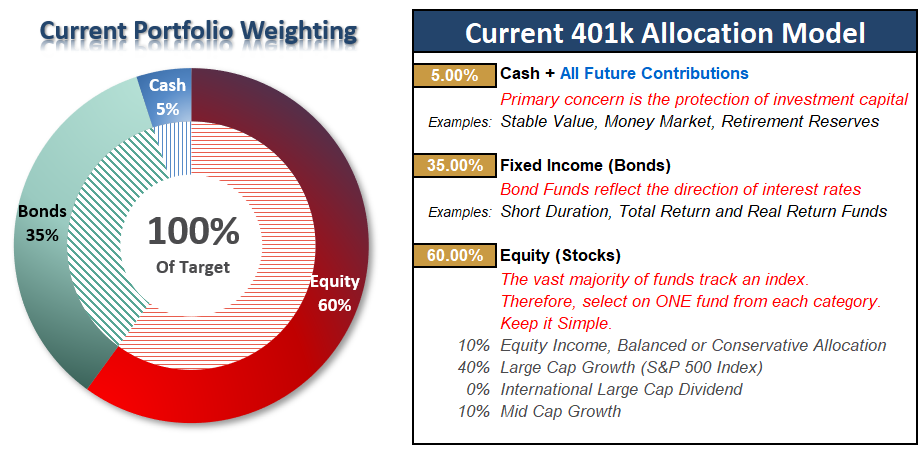
There are 4-steps to allocation changes based on 25% reduction increments. As noted in the chart above a 100% allocation level is equal to 60% stocks. I never advocate being 100% out of the market as it is far too difficult to reverse course when the market changes from a negative to a positive trend. Emotions keep us from taking the correct action.

Market Fails To Rally
As discussed at length in the main body of this missive, the market remains deeply oversold short-term. We continue to expect a rally this coming week to take some action to reduce overall portfolio risk.
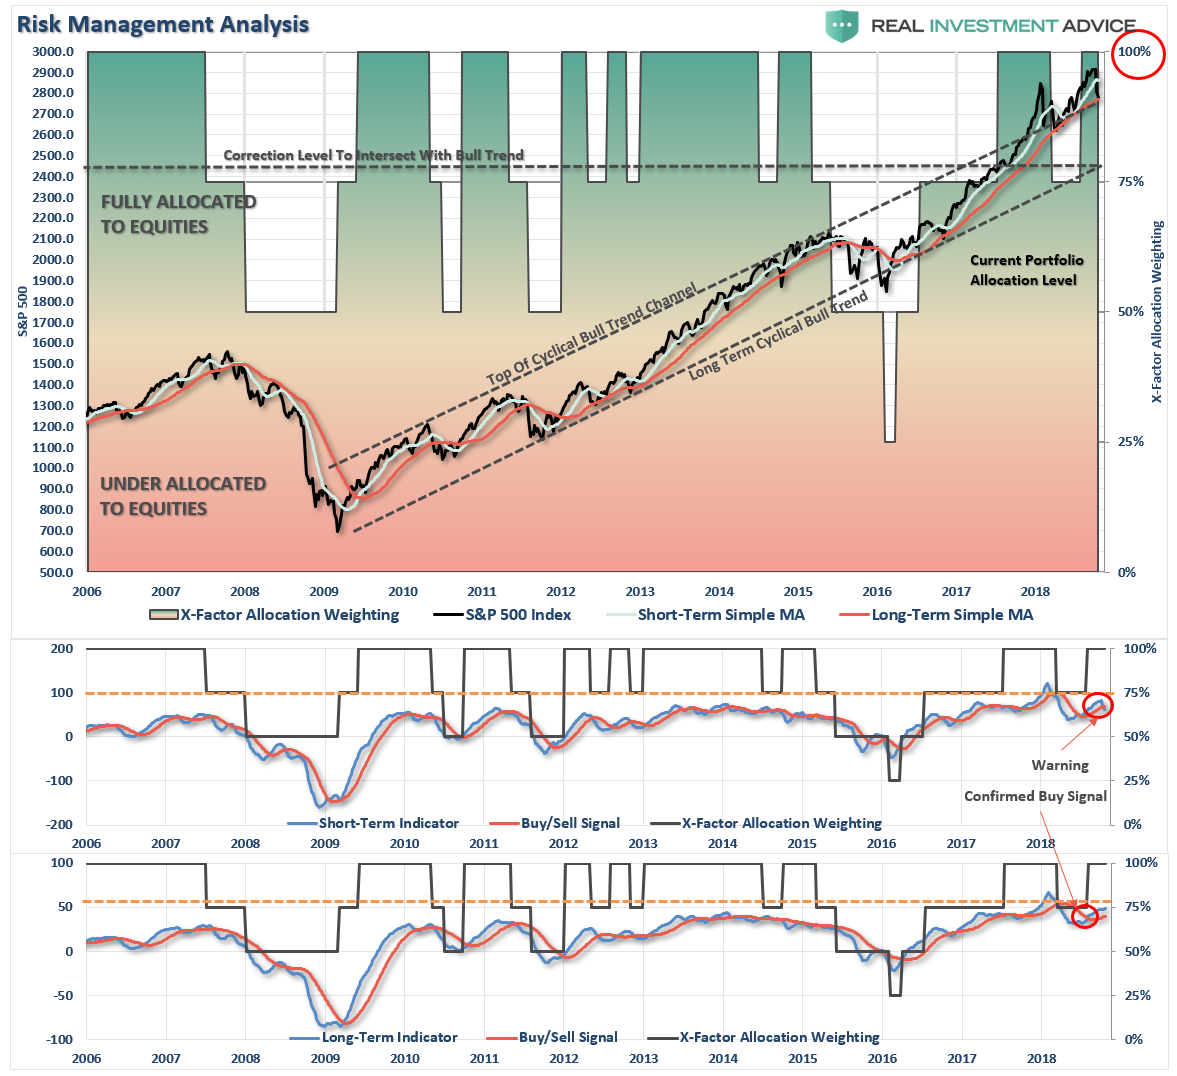
Currently, we have our FIRST of FOUR sell-signals in place. The first signal is simply a “WARNING” to pay attention to what is currently happening in the markets. Think of it as a “yellow flashing light” at an intersection – slow down and be aware of your surroundings.
As noted, there are indeed some early indications that things have changed. However, with the markets VERY oversold, the best course of action going into next week is use ANY rally next week to make sure your 401k plans are balanced. Use the following guidelines for now.
- If you are overweight equities – reduce international and emerging market exposure and add to domestic exposure if needed to bring portfolios in line to target weights.
- If you are underweight equities – Hold for the moment and let’s see if the market can stabilize.
- If you are at target equity allocations use rallies to rebalance risk in portfolios.
Unfortunately, 401k plans don’t offer a lot of flexibility and have trading restrictions in many cases. Therefore, we have to minimize our movement and try and make sure we are catching major turning points. Over the next couple of weeks, we will know for certain as to whether more changes need to be done to allocations as we head into the end of the year.
If we get a confirming SELL signal, we will begin discussing reducing the target allocation model.
If you need help after reading the alert; don’t hesitate to contact me.
Current 401-k Allocation Model
The 401k plan allocation plan below follows the K.I.S.S. principle. By keeping the allocation extremely simplified it allows for better control of the allocation and a closer tracking to the benchmark objective over time. (If you want to make it more complicated you can, however, statistics show that simply adding more funds does not increase performance to any great degree.)
401k Choice Matching List
The list below shows sample 401k plan funds for each major category. In reality, the majority of funds all track their indices fairly closely. Therefore, if you don’t see your exact fund listed, look for a fund that is similar in nature.
