Wolf Richter wolfstreet.com, http://www.amazon.com/author/wolfrichter
Seattle prices fall sharply. New York condo prices nearly flat for the year. First feeble declines in San Francisco, Dallas, Denver, etc. Something is afoot.
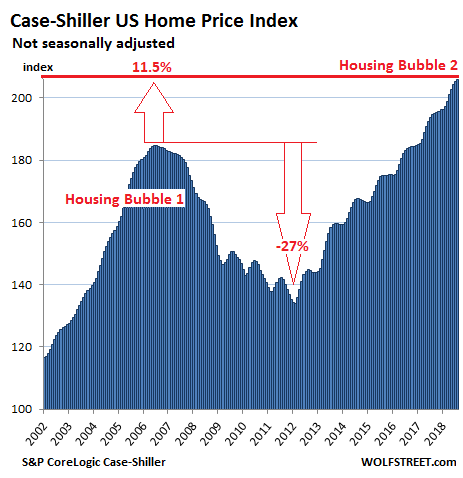
On the surface, it still looks strong. Single-family house prices in the US rose 5.8% in August compared to a year ago (not seasonally-adjusted), according to the S&P CoreLogic Case-Shiller National Home Price Index released this morning. This growth rate has been declining and now has fallen below 6% for the first time this year. The index is 11.5% above the July 2006 peak of “Housing Bubble 1” in this millennium, which was called “bubble” and “unsustainable” only after its collapse. But we forget, and now, this peak of the collapsed bubble has become the new-normal base of a “healthy” housing market. The index has surged 53% from the bottom of “Housing Bust 1”:
The Case-Shiller Home Price Index lags behind by design. It is a rolling three-month average; today’s release is for June, July, and August. The index is based on “sales pairs.” It compares the sales price of a dwelling in the current month to the last transaction of the same dwelling years earlier. The index incorporates other factors and uses algorithms to arrive at each data point, but it does not provide dollar-price levels, as a median price index does. The index is focused on single-family houses but has some special sub-indices for condos. It was set at 100 for January 2000; an index value of 200 means prices as figured by the index have doubled — which they have for nearly all metros on this list.
The index is not inflation adjusted but is itself a measure of inflation — not of consumer price inflation but of asset price inflation, specifically housing-price inflation. It shows to what extent the dollar is losing purchasing power with regards to buying the same dwelling over time.
For a few months now, we have seen the first indications in some of the hot local housing markets that fundamentals are deteriorating: Declining sales, rising inventories, increasing number of days on the market, and the like, though their prices as measured by the Case-Shiller Index hadn’t turned. Seattle was one of them, but now prices are decidedly turning in Seattle.
So here are the most splendid housing bubbles in major metro areas in the US:
Seattle:
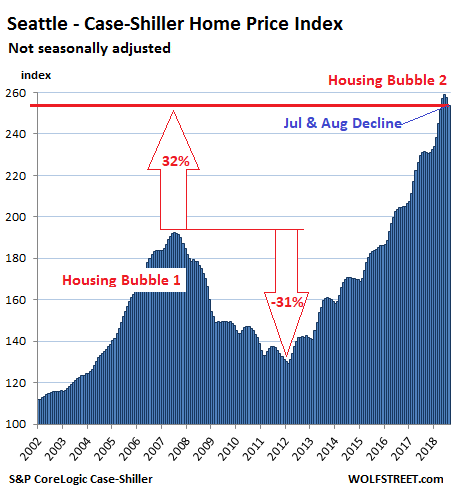
Oh-la-la! After a historic spike, Seattle metro home prices performed a vile and unthinkable act: They dropped 1.6% in August from July, down 1.6% in just one month! This comes after they’d edged down a bit in July from June. Over both months combined, index lost 2%. This decline, after the spike, took the index all the way back to, well, April. The month-to-month decline in August is particularly interesting because the August readings (for June, July, and August) are seasonally not weak, and price increases were the norm in every August since the housing bust, except 2014 when the index remained flat.
So now the scenario is changing in Seattle. This likely confirmed the inflection point I noted last month. Over the past 12 months, the index is still up 9.6%, but that’s down from the 12.0% year-over-year increase of the July reading. The index is up 31.9% from the peak of Seattle’s crazy Housing Bubble 1 (July 2007), but that reading too is down from the 35% jump in the July reading:
Boston:
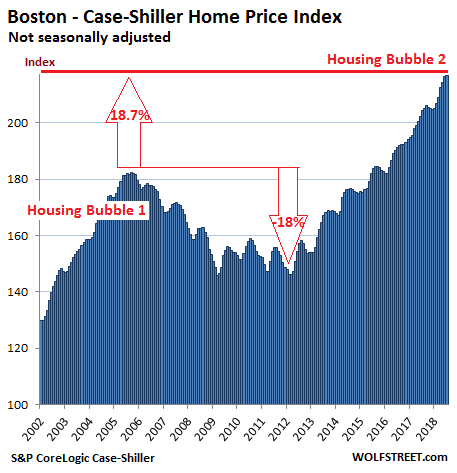
Case-Shiller Home Price Index for the Boston metro in August is essentially flat with the prior two months. It rose 5.4% from a year ago, down from a 6% pace last month. During Boston’s Housing Bubble 1, from January 2000 to October 2005, the index soared 82% before dropping. It now exceeds that crazy peak by 18.7%:
Denver:
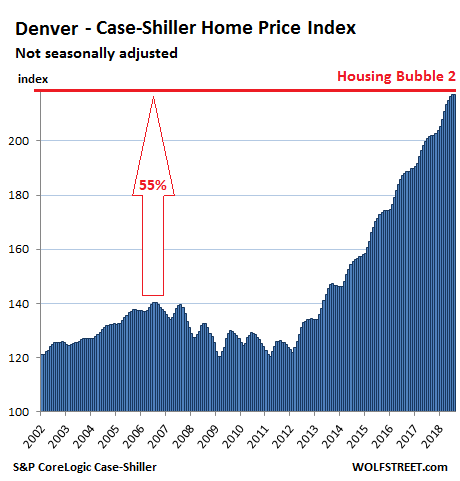
Denver metro home prices declined a fraction in August from July, according to the Case-Shiller index, putting an end to the series of 33 monthly increases in a row. The index is up 7.7% from a year ago (down from an 8.0% pace last month) and 55% from the peak in July 2006. Note the flat spot at the top:
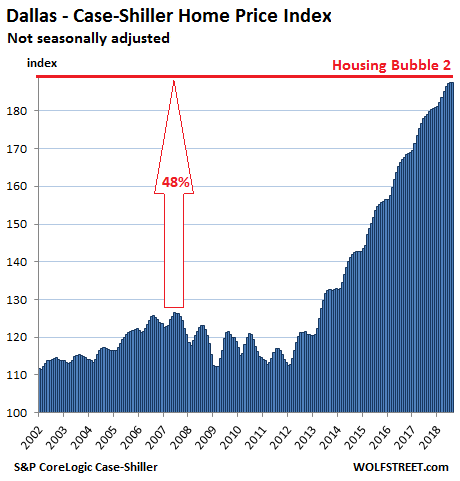
Dallas-Fort Worth:
Oh dude, Dallas too! Home prices in the Dallas-Fort Worth metro unthinkably inched down in August from July, putting an end to the glorious series of 54 monthly increases in a row. The Case-Shiller index is up 4.7% year-over-year, but that’s down from the 5.0% pace in July. Since its peak during Housing Bubble 1 in June 2007, the index has surged 48%. Note the flat spot at the top:
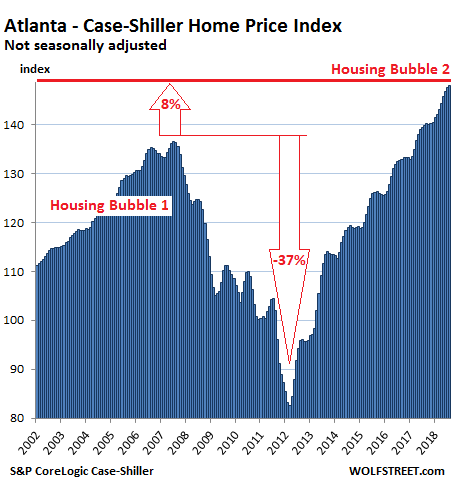
Atlanta:
Still on track: Home prices in the Atlanta metro rose 0.3% in August from July, according to the Case-Shiller index, and 5.8% over the 12-month period. They exceed the peak of Atlanta’s fabulous Housing Bubble 1 in July 2007 by 8%:
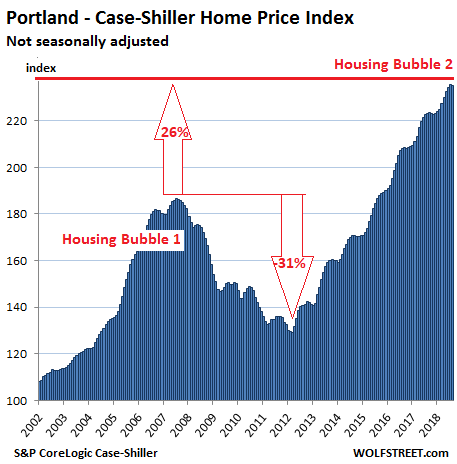
Portland:
And Portland has the malaise too. The Case-Shiller index for the Portland metro in August edged down a smidgen from a month earlier. The index is up 5.4% year-over-year (down from the 5.6% pace in July), 26% from the crazy peak of Housing Bubble 1 in July 2007, and has soared 135% since 2000:
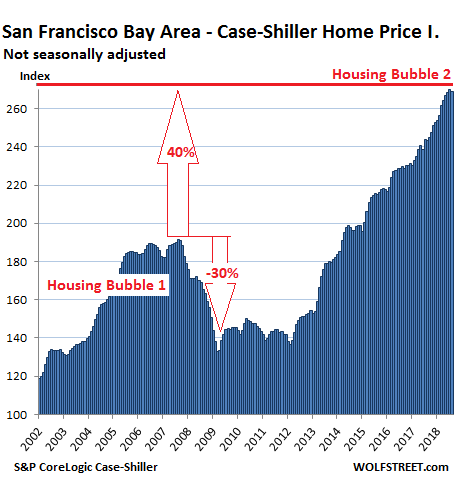
San Francisco Bay Area:
And in San Francisco! The Case-Shiller index for “San Francisco” includes five counties: The city/county of San Francisco, the northern part of Silicon Valley (San Mateo County), part of the East Bay (the counties of Alameda and Contra Costa), and part of the North Bay (Marin County). In August, the index fell 0.3% from the prior month, but was still up 10.6% from a year ago (down from the 10.8% pace last month). It’s up 41% from the peak of Housing Bubble 1 and up 169% since 2000:
Condo prices for the five-county San Francisco Bay Area, which the Case-Shiller index tracks separately, follow a similar trajectory as house prices, except they have now declined for the second month in a row on a monthly basis, and are back where they’d been in April 2018.
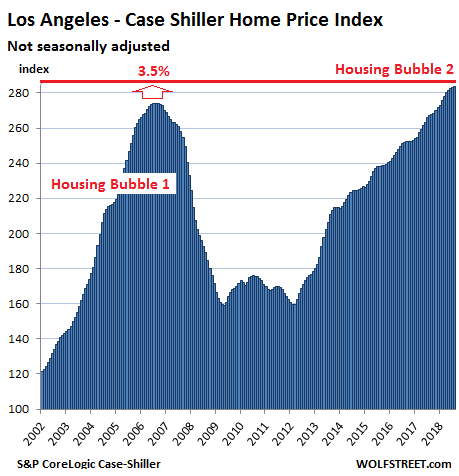
Los Angeles:
The Case-Shiller index for the Los Angeles metro rose a tad in August and is up 6.2% year-over-year (down from the 6.5% pace in July). Between January 2000 and July 2006, the index had ballooned 174% before its collapse. The index now exceeds the nutty sugar-loaf peak of Housing Bubble 1 by 3.5%:
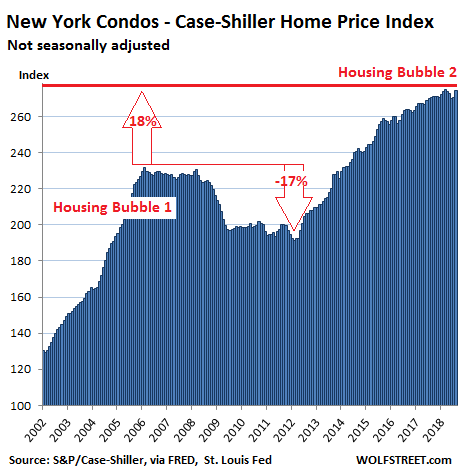
New York City Condos:
Condo prices in the New York City metro jumped 1.4% in August from July, after several months of declines, according to the Case-Shiller condo index. This took the index back to the February level. It remains down a bit from the peak in March, but is up 1.3% year-over-year. Note the rough flat spot at the top now extending back through February this year:
The Case-Shiller data covers other cities that have not yet reached prior bubble highs, such as Miami and Las Vegas, and so these cities don’t yet fit into the theme here of the “Most Splendid Housing Bubbles in America.” Some day they might. But by then, the index for some of our lead contenders here might already be heading south. And this would be typical too: during Housing Bust 1, prices in some cities turned in early 2006 and in others in the latter part of 2007.
However, there are many equally or even more splendid housing bubbles in cities that the Case-Shiller data does not cover, such as the blisteringly hot Nashville metro. So these cities cannot be included here. We miss their continued absence.