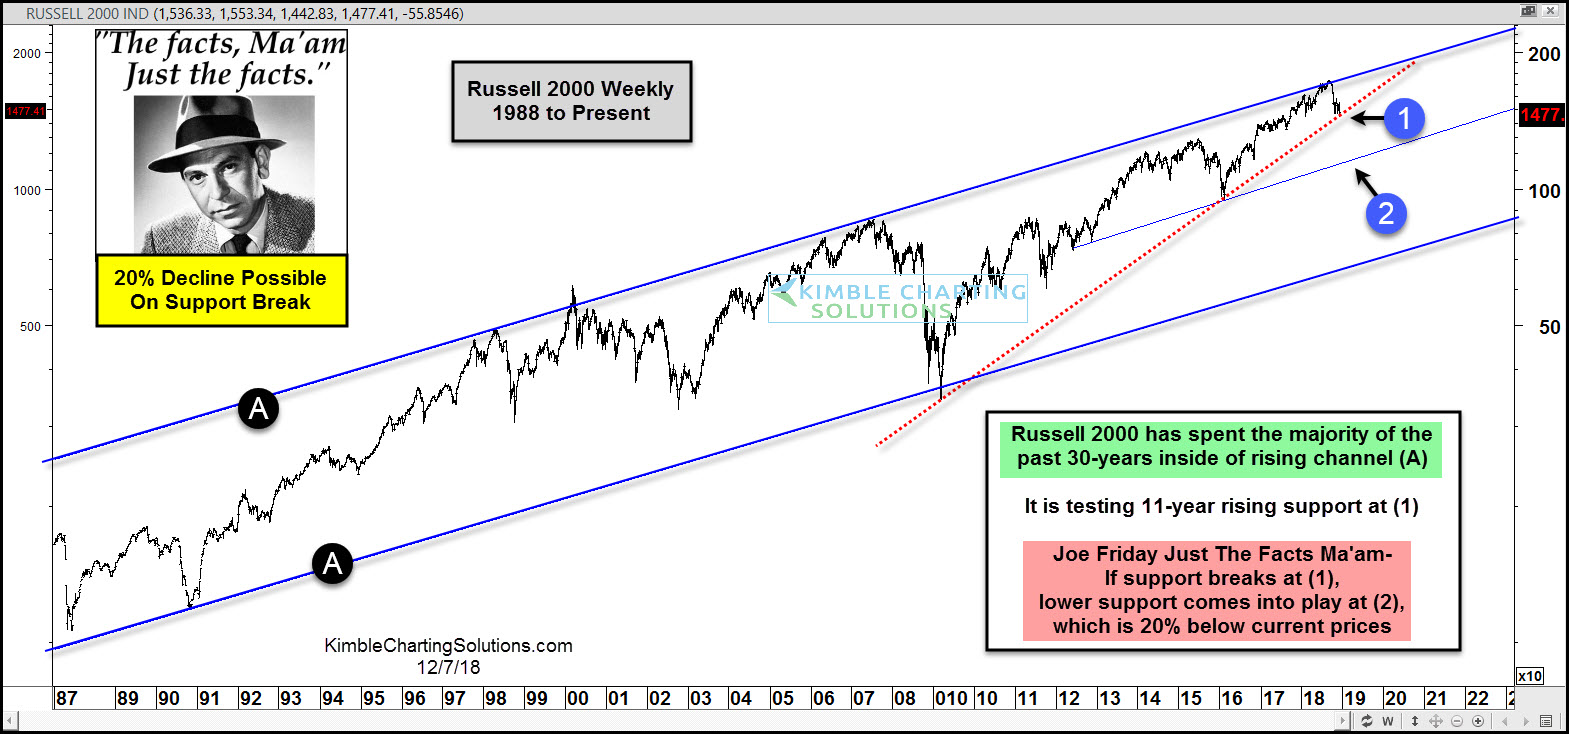
This chart looks at the Russell 2000 over the past 30-years, where it has spent the majority of that time, inside of rising channel (A).
This chart reflects that the long-term trend in small caps remains higher. Weakness this year has it testing rising support tied to the 2009 lows at (1).
Joe Friday Just The Facts Ma’am- If the Russell breaks below support at (1), it could work its way over time to channel support at (2), which is currently around 20% below current prices.
Very important support test in play for small caps currently!