“No animals were harmed during the writing of this article.”
If you listen to the media, the shocking and totally unexpected downturn last was unable to be foreseen by anyone. Thankfully, it’s now over and we can get back to the roaring bull market.
Or can we?
Mark Hulbert wrote an interesting piece recently stating:
“The stock market’s recent correction has been more abrupt than you’d expect if the market were in the early stages of a major decline.
I say that because one of the hallmarks of a major market top is that the bear market that ensues is relatively mild at the beginning, only building up a head of steam over several months. Corrections, in contrast, tend to be far sharper and more precipitous.”
His view is a common pushed out in the mainstream narrative as of late, but is based on a potentially flawed assumption the bear market began in October of this past year as shown below.
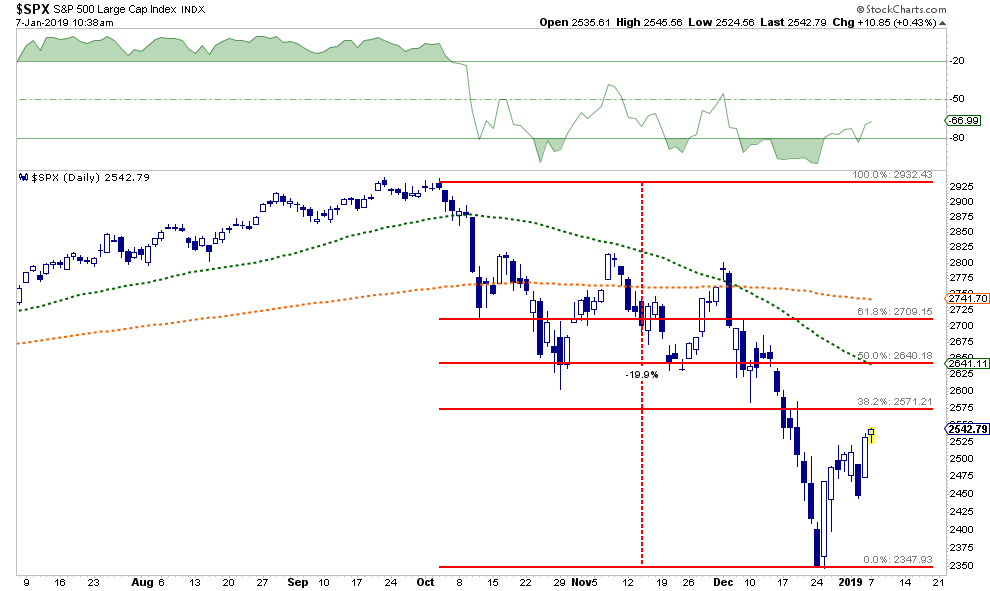
The decline from “all-time” highs took many of the persistently bullish commentators by surprise.
However, the topping process began long before October and, as shown in the chart below, the market was sending a clear warning that something was amiss.
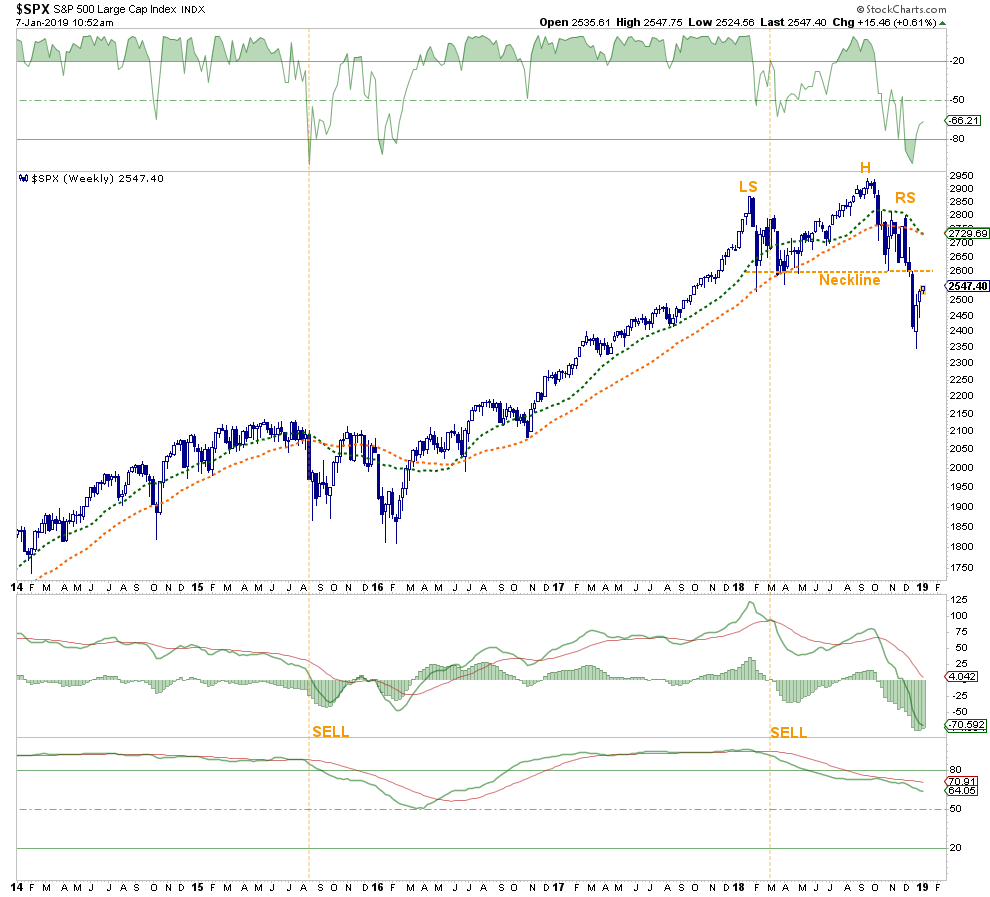
As shown, the “blow-off rally” in January formed the left-shoulder of what would eventually become a “head and shoulder” topping process. For those not into the technical “mumbo jumbo,” this pattern of prices is similar to throwing a ball up in the air. Initially, the ball has a lot of momentum as it begins it rise. However, at a point, the force of gravity slows the momentum of the rise until, for a brief moment, the ball is motionless before falling back to earth.
Markets work much the same. Eventually, the momentum of the rise in prices becomes too far extended above long-term price trends, which act like gravity, and prices “fall back to earth.” The chart below shows the previous momentum driven rise and fall of the markets.
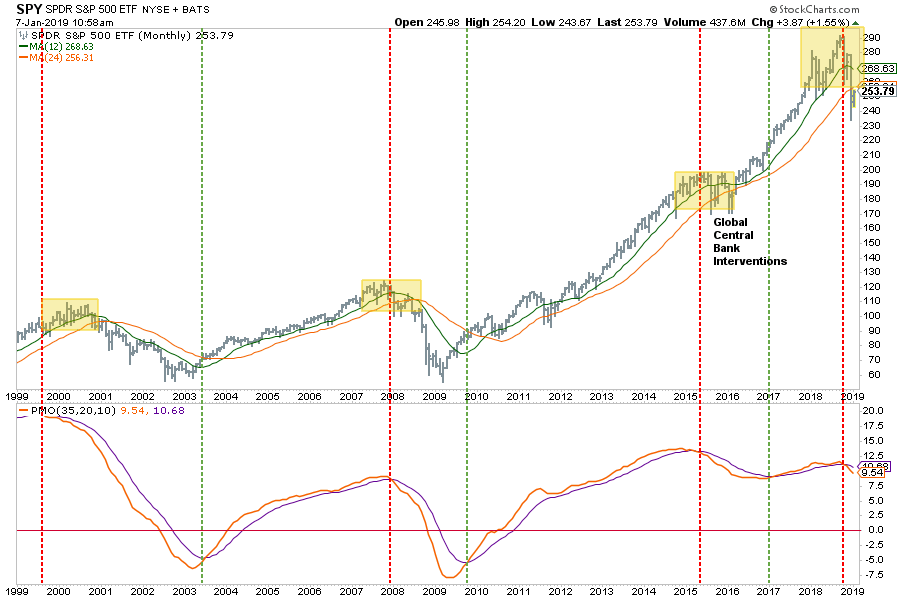
The yellow-shaded boxes denote the points where price momentum began to struggle to move higher. The lines in the bottom pane denote the change to price-momentum from positive to negative.
It is important to note that in late 2015, and early 2016, the market had begun a topping process that should have evolved into a deeper overall correction. However, just as longer-term trend lines were being violated, global Central Banks leapt into action with a flood of liquidity to offset the risk of a disorderly “Brexit” at a time the Federal Reserve was starting to hike overnight lending rates in the U.S.
While the “Brexit” issue is still ongoing, the risk to the market never actually matured. Therefore, the flood of global liquidity only had one place to go and drove asset prices skyward over the next 18-months.
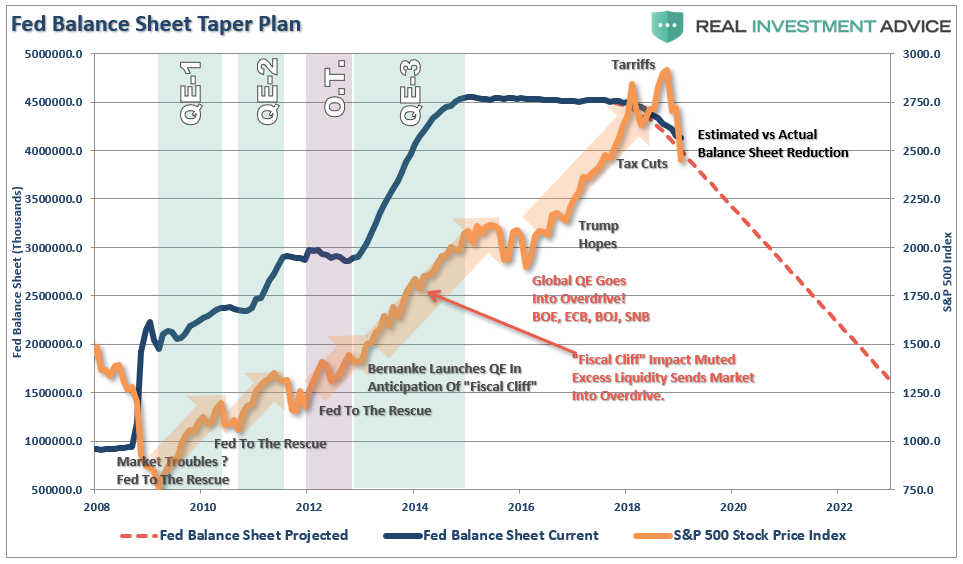
However, today, that liquidity backdrop has changed dramatically. The Fed has hiked rates from near 0% to over 2%, and are slated to do more this year, and are extracted liquidity from the markets at a rate averaging $50 billion per month. I have shown the following chart before, but given the current environment, it is worth reviewing again.
But it isn’t just the extraction of liquidity from the markets which will likely weigh on the markets over the course of the next year. As I wrote back in April of 2018 there are 10-other reasons weighing on markets:
- Global Central Banks are reducing liquidity flows
- Global economic growth continues to weaken
- “Trade Wars” and “Tariffs” are still a threat
- Valuations remain elevated
- High-yield spreads still remain compressed
- Interest rates are still rising
- Price volatility has picked up sharply
- Investors remain aggressively allocated to equities
- Earnings estimates are still too high and on the decline.
- Debt loads remain extremely high and are vulnerable to exogenous events.
The backdrop of the market currently is vastly different than it was during the “taper tantrum” in 2015-2016, or during the corrections following the end of QE1 and QE2. In those previous cases, as I stated, the Federal Reserve was directly injecting liquidity and managing expectations of long-term accommodative support. Valuations had been through a fairly significant reversion, and expectations had been extinguished.
None of that support exists currently.
Let me conclude with this quote from John Hussman:
“At its core, investment is about valuation. It’s about purchasing a stream of expected future cash flows at a price that’s low enough to result in desirable total returns, at an acceptable level of risk, as those cash flows are delivered over time. The central tools of investment analysis include an understanding of market history, cash flow projection, the extent to which various measures of financial performance can be used as “sufficient statistics” for that very long-term stream of cash flows (which is crucial whenever valuation ratios are used as a shorthand for discounted cash flow analysis), and a command of the basic arithmetic that connects the current price, the future cash flows, and the long-term rate of return.
At its core, speculation is about psychology. It’s about waves of optimism and pessimism that drive fluctuations in price, regardless of valuation. Value investors tend to look down on speculation, particularly extended periods of it. Unfortunately, if a material portion of one’s life must be lived amid episodes of reckless speculation that repeatedly collapse into heaps of ash, one is forced to make a choice. One choice is to imagine that speculation is actually investment which is what most investors inadvertently do. The other choice is to continue to distinguish speculation from investment, and develop ways to measure and navigate both.
At present, stock market investors are faced with offensively extreme valuations, particularly among the measures best-correlated with actual subsequent market returns across history. Investment merit is absent. Investors largely ignored extreme ‘overvalued, overbought, overbullish’ syndromes through much of the recent half-cycle advance, yet even since 2009, the S&P 500 has lost value, on average, when these syndromes were joined by unfavorable market internals.”
As I discussed previously, there is a reasonably high possibility, the bull market that started in 2009 has ended. If that is indeed the case, the current bounce, which we have been anticipating, will likely not last for long. In other words, it currently looks, and feels, like a “dead cat bounce,” in technical terms.
With the market still oversold in the short-term BUT with a confirmed “weekly sell signal” in place, I want to reiterate that portfolio management processes have now been switched from “buying dips” to “selling rallies” until the technical backdrop changes.
Therefore, use rallies to:
- Re-evaluate overall portfolio exposures. We will look to initially reduce overall equity allocations.
- Use rallies to raise cash as needed. (Cash is a risk-free portfolio hedge)
- Review all positions (Sell losers/trim winners)
- Look for opportunities in other markets
- Add hedges to portfolios
- Trade opportunistically (There are always rotations which can be taken advantage of)
- Drastically tighten up stop losses. (We had previously given stop losses a bit of leeway as long as the bull market trend was intact. Such is no longer the case.)
There remains an ongoing bullish bias which continues to cling to belief this is “just a correction” in an ongoing bull market. However, there are ample indications, as stated, the decade long bull market has come to its inevitable conclusion.
If the bulls are right, then it is a simple process to remove hedges and reallocate back to equity risk accordingly.
However, if the bull market has indeed ended for now, a more conservative stance in portfolios will protect capital in the short-term. The reduced volatility allows for a logical approach to make further adjustments as the correction becomes more apparent. (The goal is not to be forced into a “panic selling” situation.)
It also gives you the opportunity to buy at deeply discounted values.
For now, we continue to look sell into rallies.