via upfina:
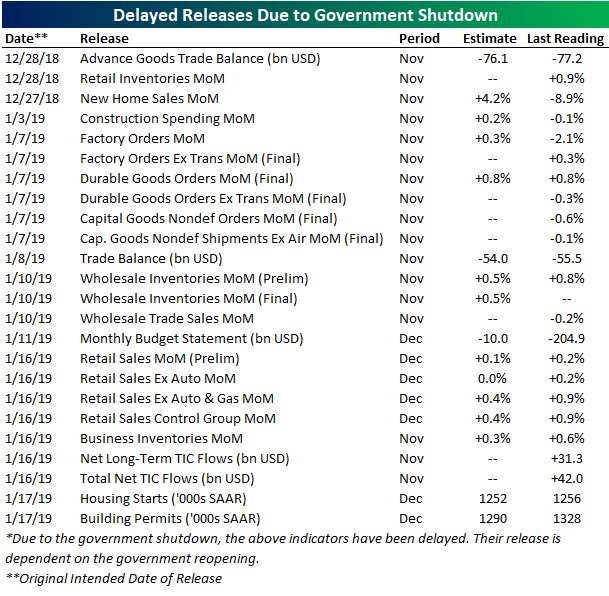
The stock market is in a unique situation because the government shutdown has delayed many economic reports from being released. The government shutdown has lasted 31 days which is 10 days longer than the previous record long shutdown. It’s quite interesting to be in the information era where data is shared instantly, yet have little information on the economy. To be clear, the data will all be updated after the shutdown ends. The table below shows the 24 government reports which haven’t been released because of the shutdown. The data is all for November and December.
The Atlanta Fed GDP Nowcast is usually very accurate at predicting the initial GDP growth report at this stage in the quarter. However, now it isn’t as accurate because of the missing data. It didn’t update on January 17th because the new residential construction report didn’t come out. The latest update has Q4 GDP growth being 2.8%. The New York Fed’s Nowcast is at 2.57%, and the median of 10 forecasts in the CNBC rapid recap has growth at 2.9%.
Even though the stock market hasn’t had much to trade off because of the lack of data, the S&P 500 is still up 6.54% year to date. This is the best 13 day start to the year since 1987. The S&P 500 started the year with a 13.93 forward PE multiple and now has a 15.11 PE. The stock market quickly priced in a recession at the end of 2018 and then reversed course quickly. It’s quite something to see stocks reverse so sharply with the lack of data. The biggest pieces of information stocks have had to trade off is earnings. 53 out of 505 firms in the S&P 500 have reported earnings. The EPS beat rate is 73.58% and the sales beat rate is only 52.8%.
Very Good Industrial Production Report
The December industrial report is important because there isn’t that much economic data being reported, and because the soft manufacturing data has shown weakness. We have discussed the weakness in the January Empire Fed manufacturing report and the weakening December manufacturing ISM PMI in previous articles. This report showed manufacturing was very strong. Hard data always trounces soft data. It’s important to clarify that while both hard and soft data are collected through surveys, hard data is representative of the past whereas soft data exemplifies forward looking expectations.
As you can see from the chart below, industrial production growth was 4% on a year over year basis. It was 0.3% on a monthly basis which met estimates.
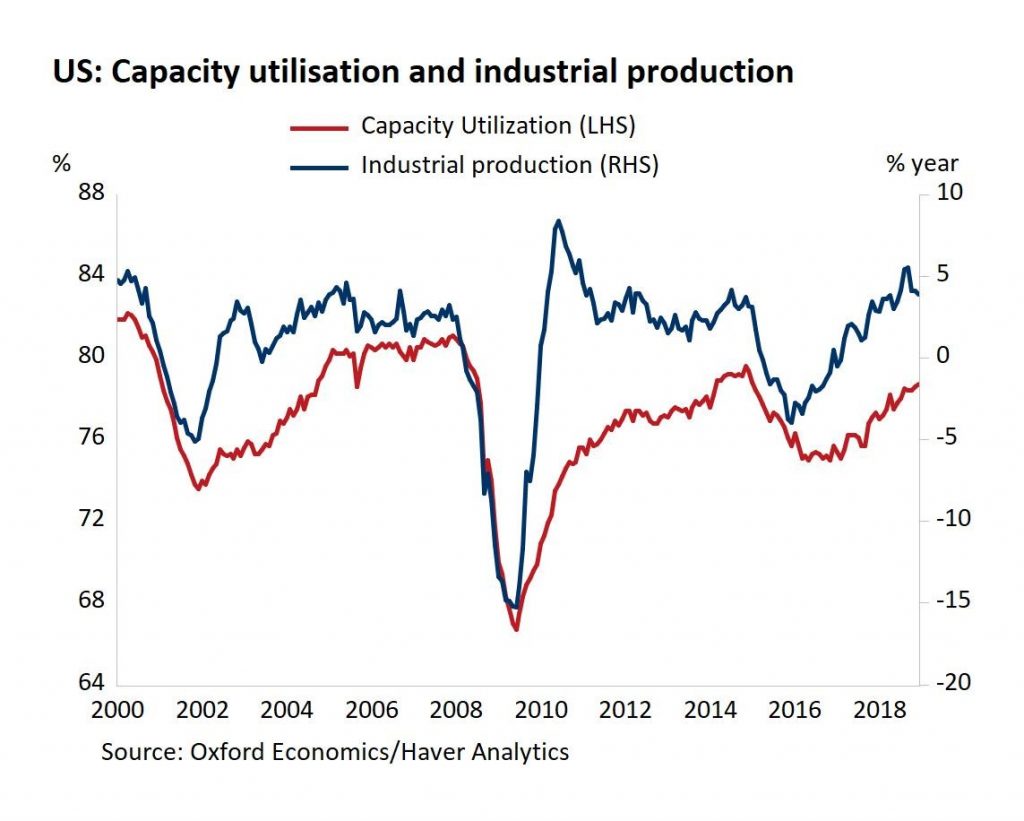
Growth was 0.4% in November. Manufacturing was very strong as monthly growth was 1.1% which was the quickest growth since February 2018. It beat estimates for only 0.1% growth. Growth was 0.1% in November. As the chart above shows, capacity to utilization increased from 78.6% to 78.7%. It peaked for the cycle at 79.6% in November 2014. If capacity to utilization continues to increase at the rate it has been increasing at in the past 12 months, it will reach the cycle peak in a little over 6 months. While reaching the peak would signal there is less room to grow, that’s a much better problem to have than a sharp growth slowdown which the ISM and Empire Fed reports implied.
Overall, manufacturing production was up 3.2% year over year. When you break down the results of this report, it looks even better than the headline reading. The chart below shows the weighted share of manufacturing sub-sectors that are contracting is the lowest since November 2010.
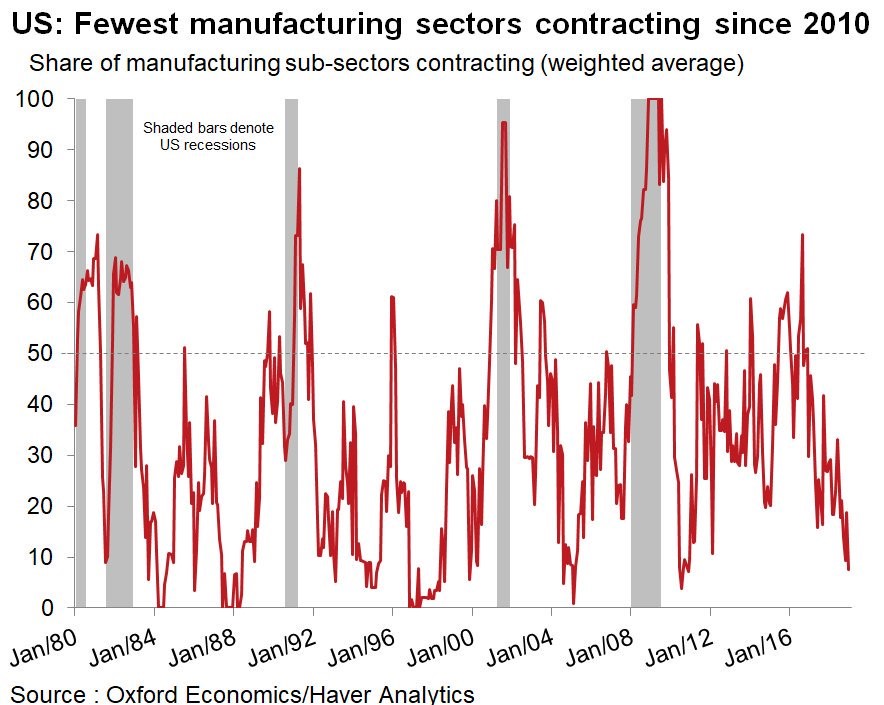
The soft data is suggesting that manufacturing is near a recession, but the hard data shows there is across the board strength. Maybe surveys were negatively influenced by the political climate and stock market volatility.
Let’s look at the details of this report. It was very great because the headline number showed strong growth even though utilities saw a 6.3% decline in production because of warm weather. The weather is irrelevant to the trend. Utilities data is the least important information when following the trend. This great report was bolstered by vehicle production, construction supplies, and business equipment. They were each up 4.7%, 1.6%, and 0.5% in the past month. They were up 7.8%, 2.1%, and 5% year over year. Mining was the strongest on a year over year basis as it was up 13.4%; it was up 1.5% monthly. Utilities were down 4.3% yearly. Finally, consumer goods were unchanged monthly and up 1% yearly.
Big Consumer Sentiment Miss
It appears consumer sentiment missed estimates by a wide margin because of political uncertainty and the stock market route. Stock market corrections don’t have long term impacts on the economy. The government shutdown has an even smaller effect on the growth trend. Specifically, the University of Michigan consumer sentiment index fell from 98.3 to 90.7. It missed expectations by the most since at least 2000 as you can see from the bottom chart below.
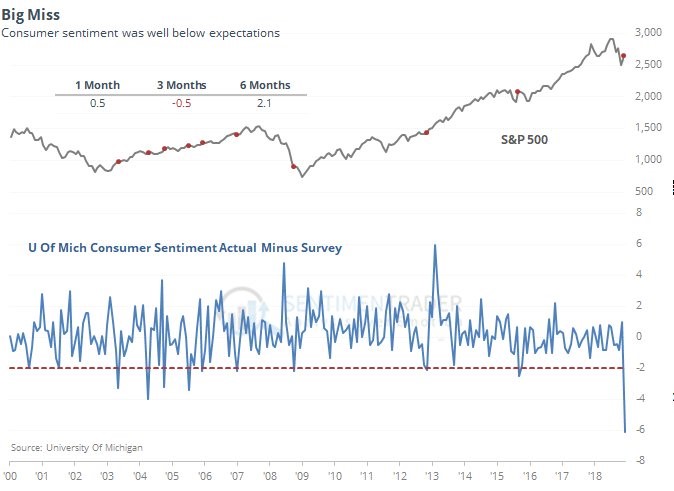
The dots on the chart of the S&P 500 show instances where the report has missed estimates by more than 2 points. Big misses have only been a mild headwind for stocks as they fall 0.5% in the next 3 months on average.
The expectations part of the index fell almost 9 points to 78.3 and the current conditions index fell over 6 points to 110. If this weakness is being caused by the trade war, the good news is the top Chinese trade negotiator is coming to the White House for 2 days on January 30th. Any discussions increase the odds of a deal.
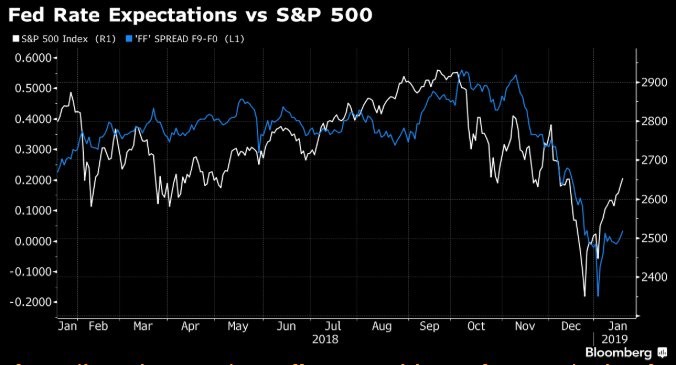
S&P 500 Versus Fed Funds Rate
One of the main reasons the stock market has increased since Christmas Eve is the dovish Fed. It’s interesting because if stocks fall, the odds of hikes fall which is bullish. If stocks rally, the odds of hikes increases, which is bearish. In the latest rally, the chart below shows stocks have increased much more than rate hike odds. That has allowed the rally to continue.
Conclusion
It appears sentiment reports were negatively impacted by political uncertainty and the declining stock market. The real economy may have been strong in December because industrial production growth was strong. The government shutdown shouldn’t worry investors because it will end eventually. Once the shutdown ends, employees will get back pay which will boost economic growth. Finally, the dovish Fed has also helped stocks. A rate hike pause could prevent the yield curve from inverting.