Wolf Richter wolfstreet.com, http://www.amazon.com/author/wolfrichter
San Francisco Bay Area & Seattle lead with biggest multi-month drops since 2012; San Diego, Denver, Portland, Los Angeles decline. Others have stalled. A few eke out records.
San Francisco and San Diego are catching the Seattle cold, and others are sniffling too, as the most splendid housing bubbles in America are starting to run into reality.
House prices in the Seattle metro dropped 0.6% in December from November, according to S&P CoreLogic Case-Shiller Home Price Index, released this morning, and have fallen 5.7% from the peak in June 2018, the biggest six-month drop since the six-month drop that ended in February 2012 as Housing Bust 1 was bottoming out. The index is now at the lowest level since February 2018. After the breath-taking spike into June, the index is still up 5.1% year-over-year, and is 27% higher than it had been at the peak of Seattle’s Housing Bubble 1 (July 2007):
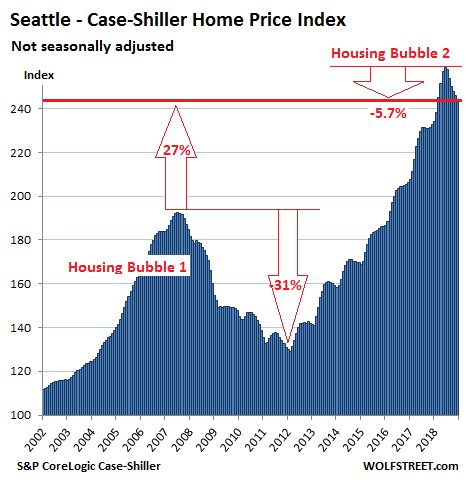
So Seattle’s Housing Bubble 2 is unwinding, but more slowly than it had inflated. Many real estate boosters simply point at the year-over-year gain to say that nothing has happened so far — which makes it a picture-perfect “orderly decline.”
San Francisco Bay Area:
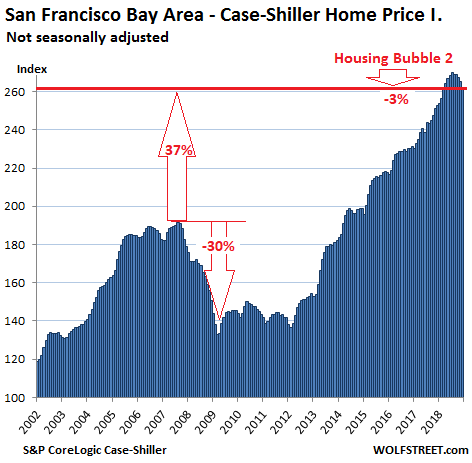
The Case-Shiller index for “San Francisco” includes five counties: San Francisco, San Mateo (northern part of Silicon Valley), Alameda, Contra Costa (both part of the East Bay ), and Marin (part of the North Bay). In December, the index for single-family houses fell 1.4% from November, the steepest month-to-month drop since January 2012. The index is now down 3% from its peak in July, the biggest five-month drop since March 2012.
Given the surge in early 2018, the index is still up 3.6% from a year ago and remains 37% above the peak of Housing Bubble 1, fitting into the theme of a perfect orderly decline:
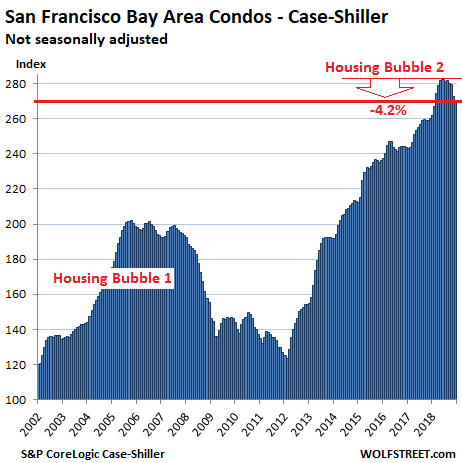
Case-Shiller also has separate data for condo prices in the five-county San Francisco Bay Area, and this index fell 0.9% in December from November, after an blistering 2.4% drop in the prior month. From the peak in June 2018, the index has now dropped 4.2%, the steepest six-month drop since February 2012:
The Case-Shiller Home Price Index is a rolling three-month average; this morning’s release tracks closings that were entered into public records in October, November, and December. By definition, this causes the index to lag more immediate data, such as median prices, by several months.
The index is based on “sales pairs,” comparing the sales price of a house in the current month to the prior transaction of the same house years earlier (methodology). This frees the index from the issues that plague median prices and average prices — but it does not indicate prices.
It was set at 100 for January 2000; a value of 200 means prices as tracked by the index have doubled since the year 2000. Every index on this list of the most splendid housing bubbles in America, except Dallas and Atlanta, has more than doubled since 2000.
The index is a measure of inflation — of house-price inflation. It tracks how fast the dollar is losing purchasing power with regards to buying the same house over time.
So here are the remaining metros on this list of the most splendid housing bubbles in America.
San Diego:
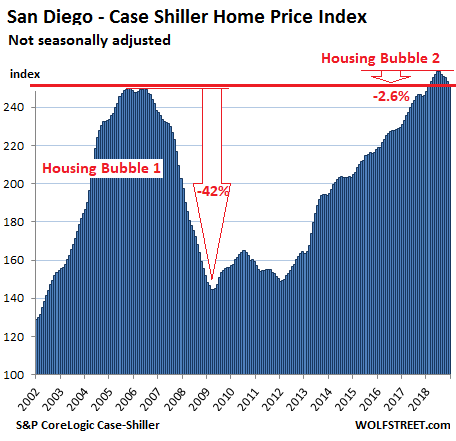
House prices in the San Diego metro declined 0.7% in December from November and are now down 2.6% from the peak in July, the biggest five-month drop since March 2012, leaving the index at the lowest level since February 2018, and just one hair above the peak of Housing Bubble 1:
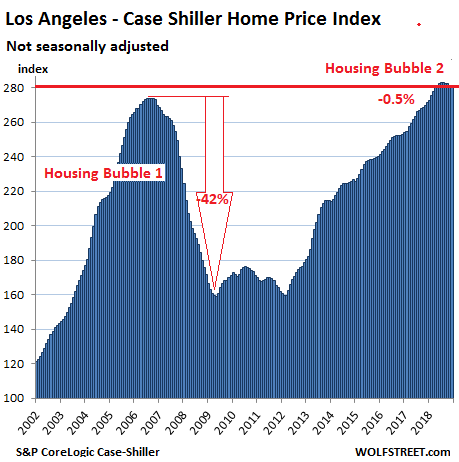
Los Angeles:
The Case-Shiller index for the Los Angeles metro was about flat in December with November but down 0.5% from the peak in August — don’t laugh, the largest four-month decline since March 2012. What this shows is just how relentless Housing Bubble 2 has been. The index is up 3.7% year-over-year:
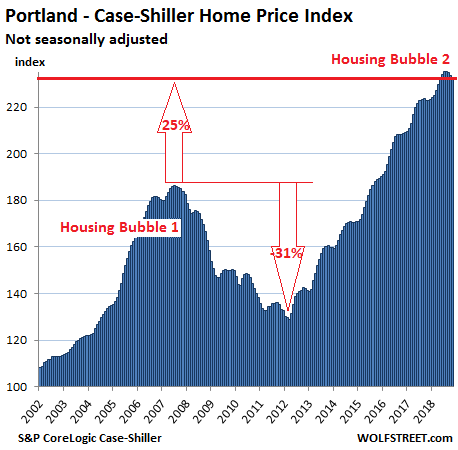
Portland:
The Case-Shiller Index for the Portland metro inched down in December from November for the fifth month in a row and is now down 1.4% from the peak in July 2018. And that was the steepest five-month drop since March 2012. Year-over-year, the index was up 3.9%:
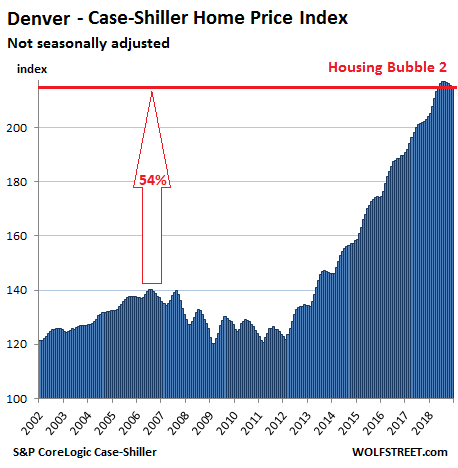
Denver:
House prices in the Denver metro edged down in December from November for the fourth month in a row, after an uninterrupted 33-month run of monthly increases. The four-month drop amounted to 0.9%, which, you guessed it, was the steeped such drop since March 2012. The index is at the lowest level since May 2018 but is still up 5.5% year-over-year:
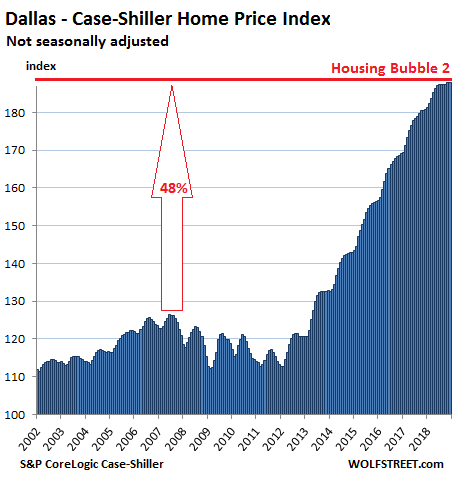
Dallas-Fort Worth:
The Case-Shiller Index for the Dallas-Fort Worth metro in December ticked up by less than a rounding error to a new record, leaving it essentially flat for the seventh month in a row. The index is up 4.0% year-over-year:
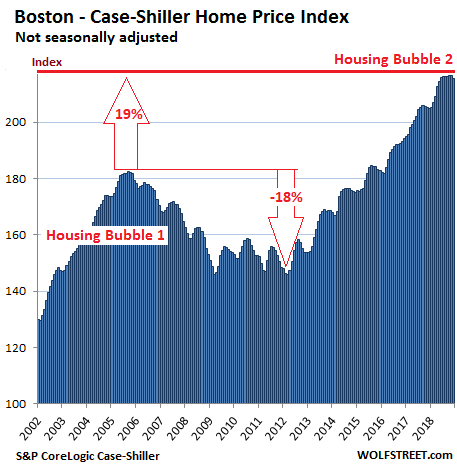
Boston:
In the Boston metro, house prices dipped 0.5% in December from a record in November and are now back where they’d been in June. The Case-Shiller Index is up 5.3% from a year ago:
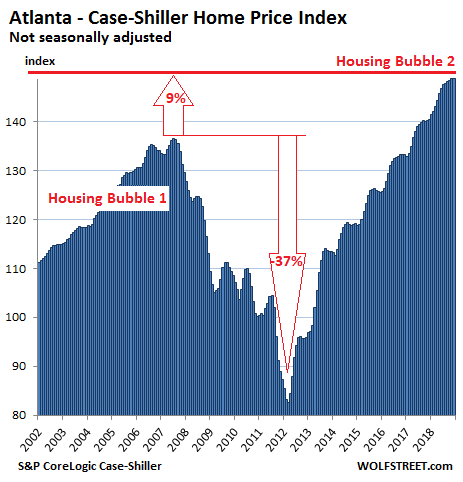
Atlanta:
The Case-Shiller Home Price Index for the Atlanta metro inched up a smidgen in December, to a new record, and is up 5.9% from a year ago:
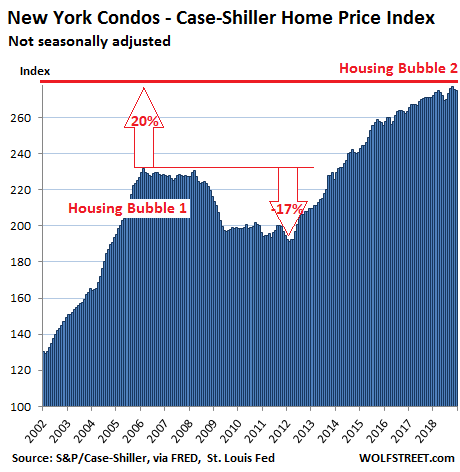
New York City Condos:
The Case-Shiller index for condo prices in the New York City metro ticked down in December for the second month in a row after a mighty bounce in September and an uptick in October. This index can be volatile, but after all these bounces and declines, the index was up just 1.5% from a year ago, the smallest year-over-year price gain on this list of the most splendid housing bubbles in America:
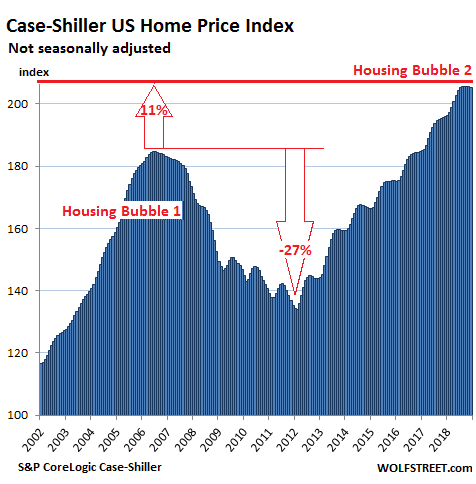
On a national basis, these individual markets get averaged out with other markets that didn’t quite qualify for this list since their housing bubble status has not reached the ultimate splendidness yet. Some of those markets, such as the huge metro of Chicago, remain quite a bit below their Housing Bubble 1 peaks and are now declining, while others are shooting higher.
So the Case-Shiller National Home Price Index has been about flat since July, but is still up 4.7% year-over-year and is 11% higher than it had been at its prior peak in July 2006 during Housing Bubble 1:
It always boils down to this: Regardless of how thin you cut a slice of bologna, there are always two sides to it. When home prices drop after a housing bubble, there are many losers. But here are the winners – including a whole generation. Listen to my latest podcast, an 11-minute walk on the other side… THE WOLF STREET REPORT