Wolf Richter wolfstreet.com, http://www.amazon.com/author/wolfrichter
And how it compares to what happened during the Financial Crisis.
The goods-based segment of the economy is heading for rough waters, and it is further diverging from the path of the services-based segment of the economy that is still growing at a solid rate: that’s what the current inventory pileup tells us.
When inventories pile up, sales by those companies that supply that inventory do well. But companies that sit on that inventory and have trouble selling it will at some point cut their orders to reduce their inventories. When this happens, sales drop all the way up the supply chain.
And the inventory pileup, particularly in durable goods at the wholesale level, just keeps getting worse. In January, these inventories surged 11.7% from January a year ago, and are up 17% from January two years ago, hitting $415 billion, the highest ever, according the Commerce Department this morning.
At the same time, sales of durable goods by these wholesalers rose 4.7% in January year over year, to $245.6 billion. Sales had peaked in September last year.
And the inventory-to-sales ratio for durable goods rose to 1.69 in January, the highest ratio since August 2016, back when the goods-based sector was coming out of the last inventory pileup that had led to the recession in the goods-based sector that had dragged down overall economic growth for 2016 to just 1.6%, the worst since the Financial Crisis. Only the much larger services sector, which was still growing, kept the economy out of an overall recession.
During 2015 and 2016, wholesales of durable goods declined and inventories were whittled down as wholesalers cut orders, which slowed down the whole supply chain. It was a drag on GDP, but eventually the inventory-to-sales ratio was brought into line. Now a similar scenario is building up:
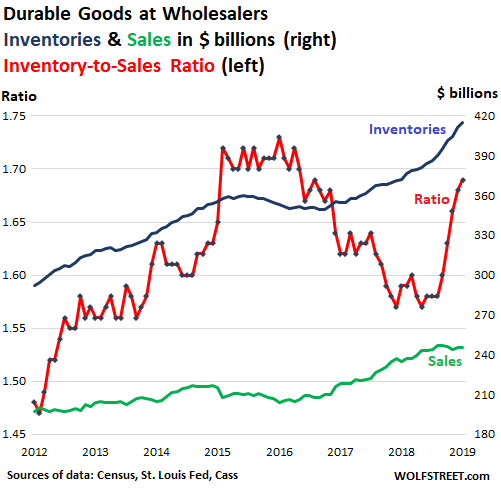
Over the seven years of the chart, sales rose 23%, from $197 billion in January 2012 to $246 billion in January 2019. But inventories surged 41%, from $295 billion to $415 billion. This inventory buildup is considered investment in inventories, and as such is added to GDP growth. When inventories get whittled down, the reduction is subtracted from GDP.
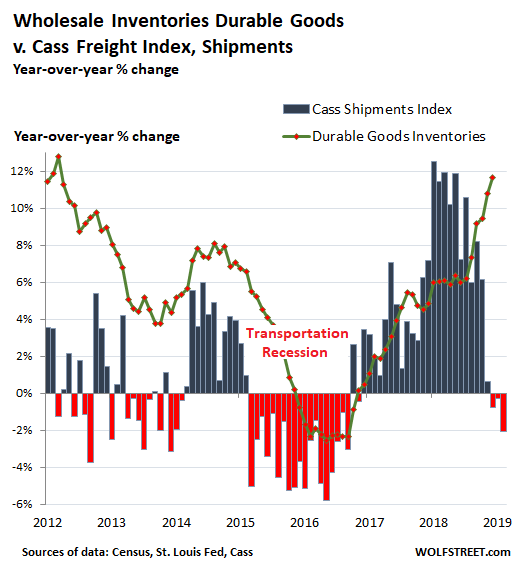
The transportation sector fell into a steep recession in 2015 and 2016, based on the Cass Freight Index for Shipments, which covers consumer and industrial goods shipped by all modes of transportation — truck, rail, barge, and air — but does not cover commodities such as grains.
Now a similar pattern is forming: Inventories have been piling up, and shipment volume of goods, as tracked by the Cass Freight Index, have started to decline on a year-over-year basis.
The chart below shows the Cass Freight Index for Shipments (columns) and wholesale inventories of durable goods (green line), both expressed as percent change from the same month a year earlier. Inventories follow shipments with a lag:
For folks who like to compare routine slowdowns to the Financial Crisis, I include that beloved era in the chart below. It shows inventories and sales in billion dollars (right scale) and the inventory-to-sales ratio (left scale). On the surface, there appear to be some parallels with the current dynamics; but in a moment, we’ll get to why that’s only on the surface.
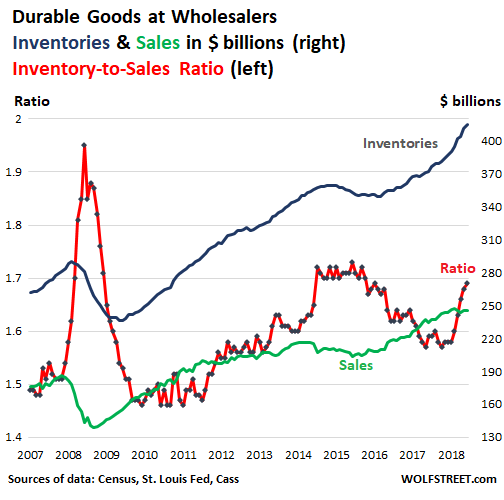
On the surface, there are starting to be parallels with the conditions before and during the Financial Crisis. But what happened at the time? Secretary of the Treasury Hank Paulson got in front of Congress and told the entire world that he needed unlimited powers to bail out Wall Street, or else the world would come to an end. The moment he said this, everyone in the real economy that had so far more or less brushed off the turmoil on Wall Street pulled the ripcord. People still bought food and went to restaurants but they stopped buying big-ticket items such as cars or couches, and companies stopped ordering stuff, and cancelled what they could, and supply chains froze up.
The chart below shows the percent changes at wholesalers of durable goods sales and inventories, along with the inventory-to-sales ratio. It’s the same data as the chart above, but sales and inventories are expressed in percent-change from a year earlier: Sales plunged by 17% year-over-year in October 2009. That was a wild plunge in sales compared to the current 4.7% year-over-year increase in sales:
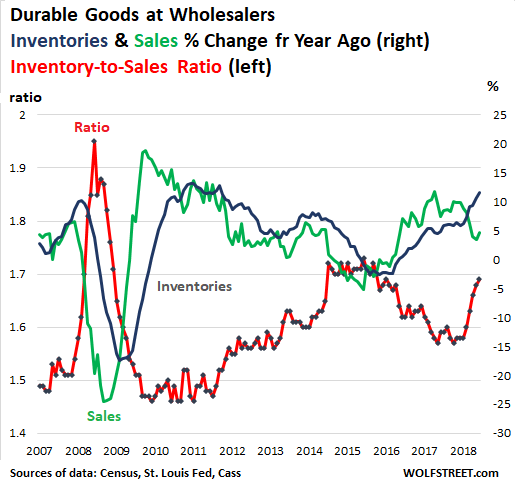
During the Financial Crisis, the inventory-to-sales ratio spiked because sales collapsed. These days, sales are still increasing year-over-year, though sequentially they have started to flatten out. The inventory pileup these days is happening because inventories have been rising persistently faster than sales have been rising – a very different set of dynamics than a collapse in sales. One was a panic that led to what was the first such crisis in my entire life, and thus a rare event; the other is just a run-of-the-mill harbinger of a routine slowdown in the goods-based sector, with no signs of a crisis in sight.
And as long as the services sector holds up – it is for now still holding up – there won’t even be an overall recession. There cannot be a recession without a pullback in services. Read… Finance & Insurance Hit it Out of the Ballpark, No Slowdown in the Huge Services Sector