by Econimica
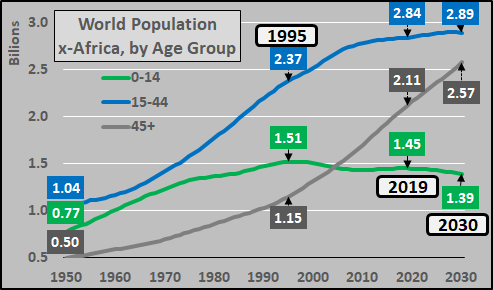
To begin, note the collapsing populations of young (0 to 15 years old) and childbearing populations (15 to 40 years old) across broad swaths of the greatest consumer nations on earth. Absent broad die-offs from war, pandemics, famine, etc.; population collapses begin from the decline of births that eventually work their way into declining childbearing populations.
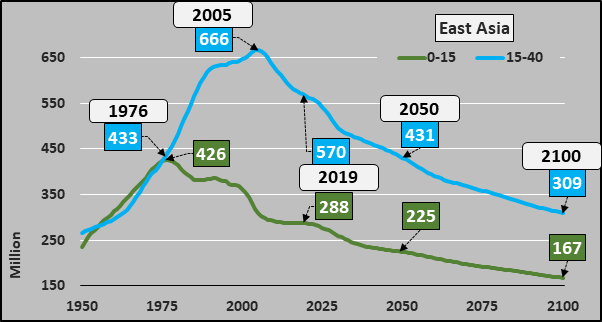
- Young, peaked in 1976 – declined by 138 million (32% decline) so far, projected to decline 259 million (61% decline) by 2100. This is based on the assumption of rising fertility rates…if they remain flat or fall further, the reality is likely to be far lower!?!
- Childbearing peaked in 2005, declined by 96 million (14% decline) so far, projected to decline 357 million (54% decline) by 2100.
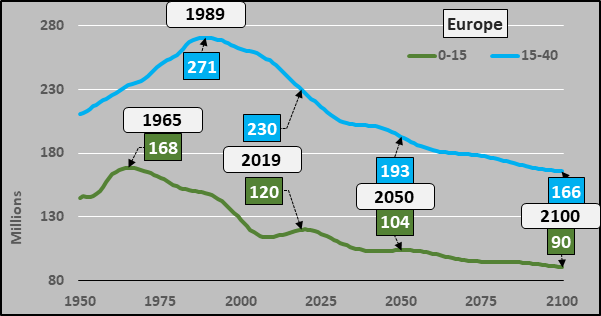
 Europe (including Russia and Eastern Europe) childbearing population (blue line) and young population (green line), below.
- Young peaked in 1965, declined by 48 million (29% decline) so far, projected to decline 78 million (46% decline) by 2100. Again, this decline is based on the assumption that fertility rates will do the exact opposite of the current reality and suddenly rise?!? If not, far lower births and resultant populations should be expected.
- Childbearing peaked in 1989, declined by 41 million (15% decline) so far, projected to decline 105 million (39% decline) by 2100.
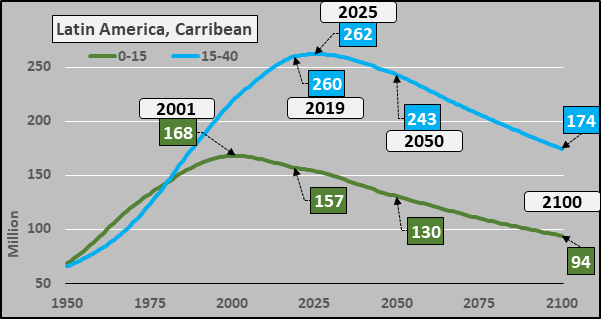
 Latin America plus Caribbean (everything in Western Hemisphere but US/Canada) childbearing population (blue line) and young population (green line), below.
- Young peaked in 2001, declined by 11 million (7% decline) so far, projected to decline by 74 million (44% decline) by 2100.
- Childbearing set to peak in 2025 and projected to decline by 87 million (33% decline) by 2100.
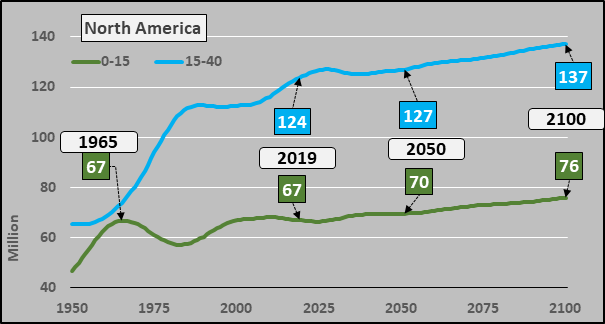
 North America (US/Canada) childbearing population (blue line) and young population (green line), below.
- Young peaked in 1965, zero growth since ’65, projected to grow by 9 million (14% increase) by 2100. I have detailed repeatedly why given current fertility rates, trends, and immigration patterns, this growth is highly unlikely and continued flat to outright declines should be the base case. Since 2007, US fertility rates have been in freefall and in 2018, the US hit a record low fertility rate of 1.72 and is still falling fast…with Canada even lower at 1.56. There is no sign nor logical rationale to anticipate a rise in fertility rates in North America.
- Childbearing projected to grow 13 million (11% increase) by 2100. Again, this is premised on unrealistically high fertility rates and immigration rates above the current reality…this is also highly unlikely and near zero growth should be the base case.
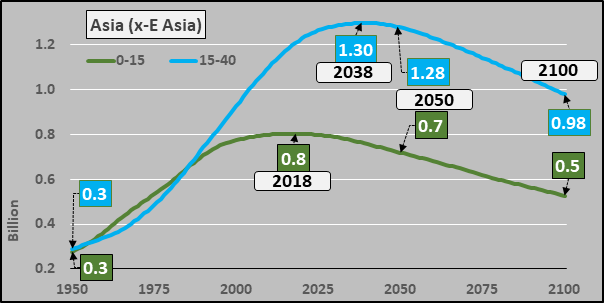
 ASIA (excluding East Asia) childbearing population (blue line) and young population (green line), below.
- Young peaked in 2018, projected to decline 275 million (34% decline) by 2100. This is India, Pakistan, Vietnam, Thailand, Indonesia, etc. plus all of Western Asia (Iraq, Iran, Turkey, Saudi Arabia, etc.).
- Childbearing projected to peak in 2038 and decline by 240 million (20% decrease) by 2100.
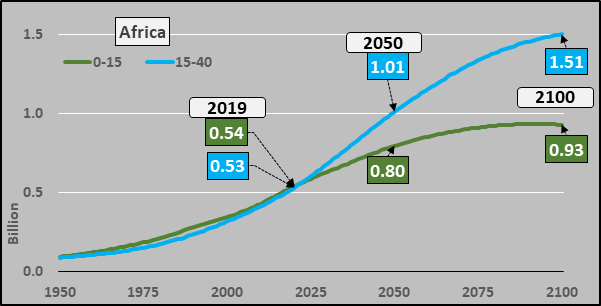
 Africa childbearing population (blue line) and young population (green line), below.
- Young projected to rise 400 million and peak around 2090!?!
- Childbearing population projected to grow nearly 1 billion through 2100.
Consider:
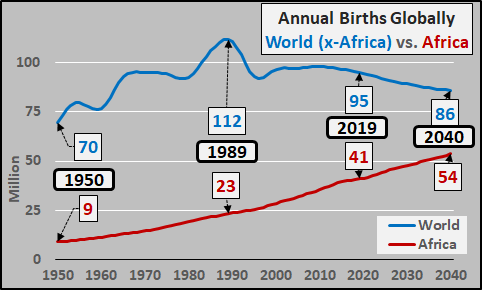
- Since 1980, Africa has grown from 11% to 17% of the worlds total population
- Since 1980, Africa has grown from 17% to 30% of annual global births
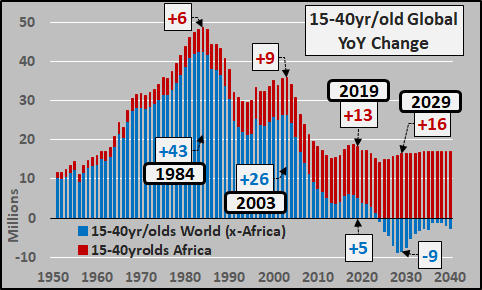
- In 1989, annual global births (excluding Africa) peaked and have declined 15% since (and still falling)
- The 3+ decade decline in global births (excluding Africa) has nearly (but not quite) been offset by increasing births in Africa
- By 2023, the worlds childbearing population (excluding Africa) will be in indefinite decline…and only Africa’s childbearing population will continue growing
- A declining childbearing population (excluding Africa) with deeply negative fertility rates (excluding Africa) is highly likely to see births fall at an accelerating rate (far more than the gradual decline predicted by the UN)
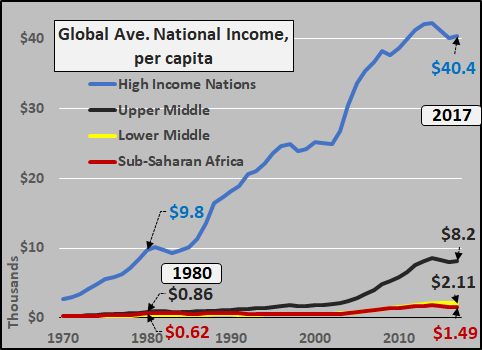
- However, over the past five decades, African income per capita has risen just 240% compared to Upper Middle income nations (China, Brazil, Russia, etc.) rising 950% and high income nations 410%…Africa is clearly losing ground
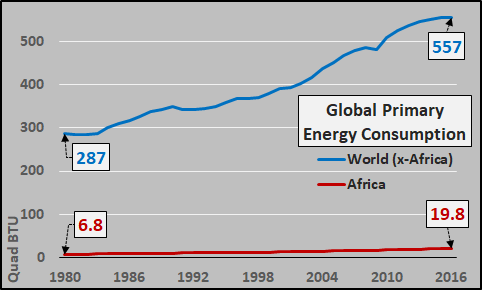
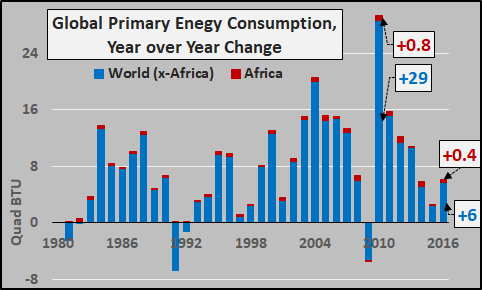
- By the best proxy for true economic activity, energy consumption, suggests Africa has grown from just 2.4% to 3.6% of global energy consumption…and the future there is not brightening.
- Africa’s economic growth is dependent on global growth (x-Africa)…but with declining global markets for exports and significant overcapacity, Africa’s export driven growth potential is very low
- Lastly, Africa (particularly Sub-Saharan Africa where most of the population growth is occurring) has one of the lowest emigration rates of any poor region.
- By 2030, Africa will be 22% of the worlds population, be 200% of annual growth among the childbearing population, and be responsible for 38% of global births…but still just estimated to be 4.6% of global energy consumption.
- In short, when excluding Africa, births have already collapsed and due to the imminent decline in childbearing population, far larger declines (also known as collapse) are imminent
The Big Picture
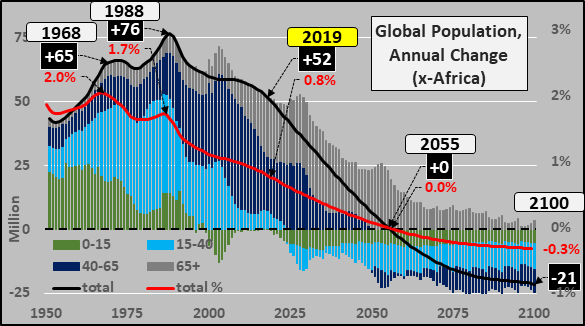
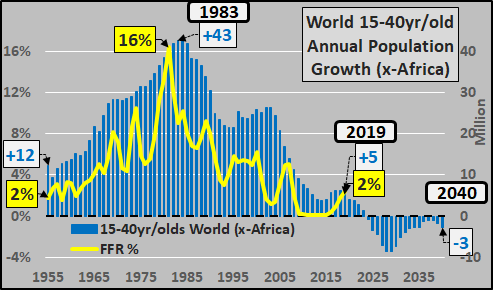
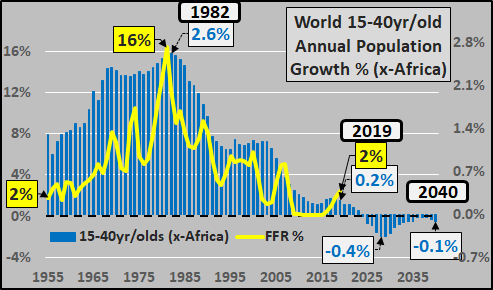
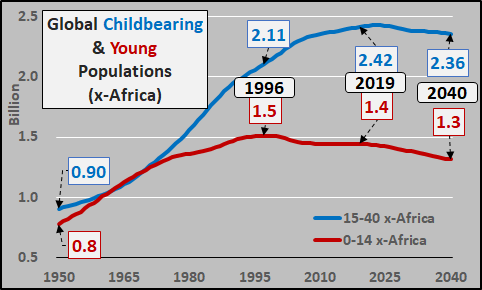
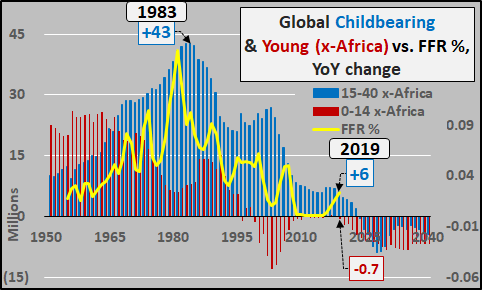
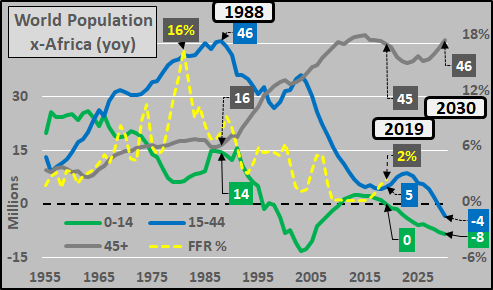
Annual global population change, excluding Africa, peaked in 1988 and growth has decelerated since. However, growth really decelerates from here and is projected to end entirely by 2055…and global depopulation (excluding Africa) is the primary global feature there-after.
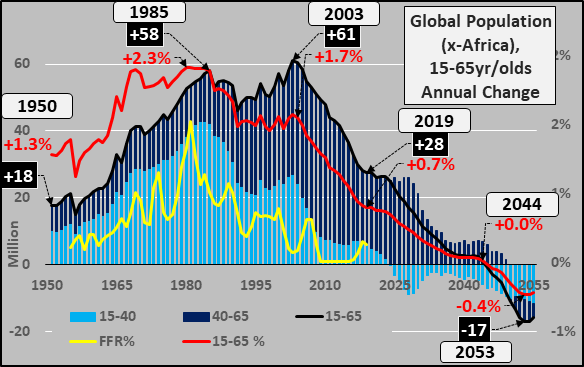
But focusing on the 15 to 65 year old working age population (x-Africa) which drives the global economy and consumption, the halving of growth in millions (and 2/3rds decline in percentage) is already in the rearview mirror. By 2040, global working age population growth is estimated to end entirely and a persistent decline (depopulation) among potential employees/consumers persists indefinitely there-on.
Why point all this out? Because it is the annual growth in the global childbearing population (excluding Africa, blue columns below) that drives demand, inflation, and the Federal Funds interest rate (yellow line). From 1950 to 1980, it was the accelerating rise in the childbearing population of potential consumers (above and beyond existing capacity) that pushed prices upward (more demand than supply) just as the Fed was hiking the cost of servicing debt (reducing growth in potential capacity). Then from 1981 to present, the deceleration of growth among the same population coincided with decelerating inflation (decelerating demand with accelerating supply from lower interest rates). The imminent declines in the same population will coincide with outright deflation (declining demand against a flat to potentially rising capacity thanks to a return to ZIRP or even NIRP).
 Next, Africa is nearly all the population growth, but little of the global immigration…
- Sub-Saharan Africa has been a relatively insignificant source of immigration since the 1980’s…and even then it never rivaled the migrations from Latin America (primarily Mexico) or presently from S. Asia. Essentially, what happens in Sub-Saharan Africa stays in Sub-Saharan Africa.
- Northern Africa has been a more significant source of migration since the 1990’s but the regions birthrates (2.8 children per female) are falling more in-line with Europe than Sub-Saharan Africa (4.9 children per female).
- Latin America was the primary source of migration but this has hugely decelerated, with Mexico experiencing a 10 fold decrease in immigration since 2005.
- The S. Asia region, (primarily India, Pakistan, Bangladesh) are producing the bulk of the worlds migrants.
