by UPFINA
As we have been discussing for about 3 quarters, the US housing market is on fire. COVID-19 spurred on the demand originally created by demographics. This trend was already going to occur anyway. Lower rates and the need to move out of cities accelerated the trend; home builders weren’t ready. This is too good of a market for homebuilders although commodities such as lumber have increased substantially making housing raw materials cost more.
New home sales exploded in March. The yearly data is skewed because of the pandemic and the monthly data is skewed because of the bad weather in February. Specifically, new home sales were up from 846,000 to 1.021 million. The best comp might be to January in which new home sales were 1.010 million. It’s going to be interesting to see how strong the spring selling season gets in April and May. Some are saying the housing market actually needs higher rates because demand is so strong. It would be healthier if prices didn’t increase this quickly.
Moreover, this is particularly the case when the US is compared to other developed market #economies, where the ratios of median #HousePrices to #income are much higher! pic.twitter.com/8SWc0Rht2I
— Rick Rieder (@RickRieder) April 23, 2021
Even though home prices have increased, the median price to income ratio in America makes housing look cheap compared to much of the developed world. As you can see, America’s 4x ratio is below all the other countries listed. It’s notable that America is a wide-open country with plenty of land. It’s nothing like Israel, Japan, and much of western Europe. America is closer to Australia and Canada which still have higher ratios. Both are known for their housing bubbles though.
America has underbuilt housing for the past decade because of the overhang from the housing bubble. It’s the best time to invest after a bubble bursts. Think of how great it was to invest in technology stocks in 2003. Now isn’t as great of a time to invest in homebuilders of course because everyone sees this playing out. The homebuilder index is already up 39% in the past 6 months and 118% in the past year. Regardless of whether those stocks are a buy, there will be much more housing built in the next 5 years.
The chart below shows the 15 year trailing measurement of housing starts.
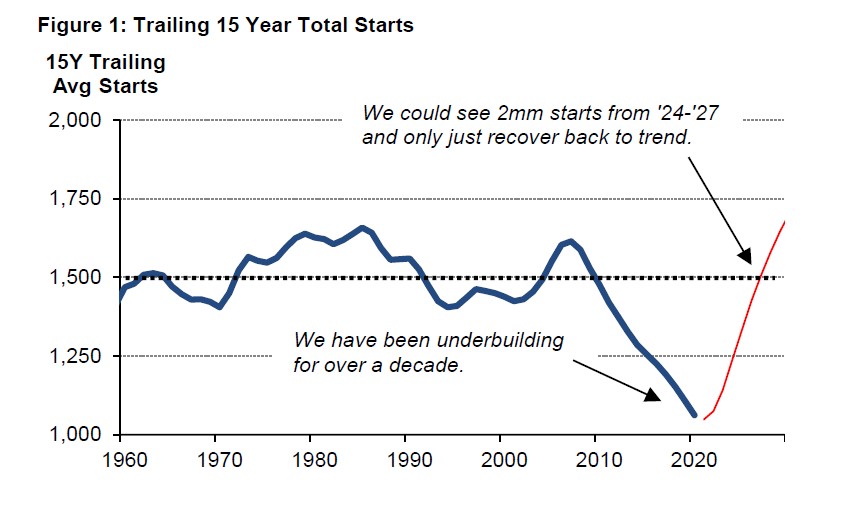
2 million starts would get America back to its long term trend. There is a housing shortage that won’t go away for a few years. It wouldn’t be a surprise for America to overbuild because that’s how cycles work. It’s interesting how there wasn’t that much overbuilding in the housing bubble. That was more about reckless speculation and loans given out to buyers that couldn’t afford homes. The fact that we didn’t start highly overbuilt explains how the reading has gotten this low.
No Margin Bubble
Margin debt is one of the most misused indicators by people claiming the stock market is in a bubble. The correct way to use it is to measure its relationship to the stock market because when stocks go up, margin debt does too. Considering how much stocks are up year over year, it would be almost impossible for margin debt to not be spiking year over year. The chart below shows this relationship perfectly.
As you can see, the past 2 bull markets ended when margin debt was up way more than the stock market. Margin debt is up similarly to those prior peaks, but the stock market is up much more than it was at those peaks. That means this isn’t a bubble with a bear market lurking. Of course, something unforeseen like COVID-19 can cause a selloff. This just means speculation won’t drive us to a bear market. The yearly change in margin debt is modestly above the stock market. Maybe we will see a correction soon, but there won’t be a crash like in 2008 and 2000.
Sure. Margin debt is collateralized by the value of a stock portfolio. So, a higher S&P 500 typically means more margin debt, i.e., more capacity for borrowing. If margin debt rises much more than the market (eg 1999, 2007), that's a bigger concern. pic.twitter.com/0aWMlSKRH2
— Nick Reece (@nicholastreece) April 23, 2021
Corporations Have A Ton Of Cash
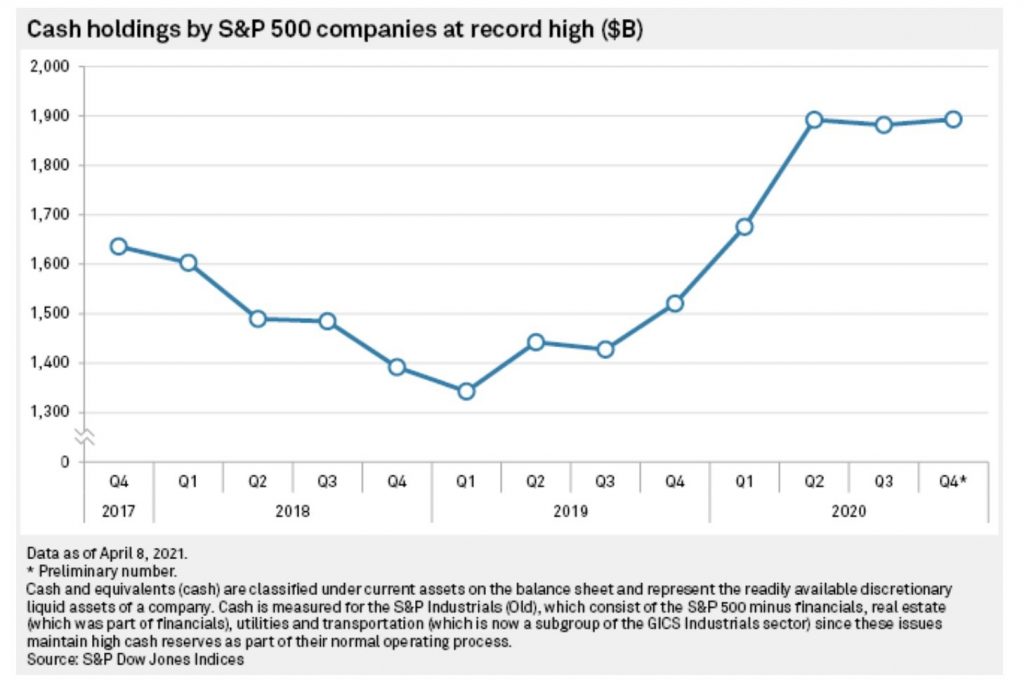
U.S. corporations have a ton of cash because they raised a lot during the COVID-19 pandemic last year and now their profits are rising. The cash ratio (cash and cash equivalents as a percentage of current liabilities) of investment grade companies was in the low 30s in Q4 which is slightly below the peak in Q2. However, it’s over 10 points above pre-pandemic levels. For non-investment grade firms, the level is in the highs 40s. It fell a bit more from Q2, but it’s almost 20% above pre-pandemic levels.
As you can see from the chart below, cash holdings by S&P 500 firms increased in the first half of 2020. Many firms suspended their buybacks in 2020 which also increased their cash hoard. This chart doesn’t even include the big burst in corporate profits that’s coming in 2021. This money will be unloaded on buybacks. Of course, it’s a much worse time to buy stocks now than it was 12 months ago. However, this will definitely keep a bid under equities.
America Is Very Concentrated
The Herfindahl Index measures the size of firms in relation to their industry. It measures concertation and competition. As you can see from the chart below, this index bottomed recently below the trough in 2000 (a lot of concentration).
Concentration of S&P 500, STOXX Europe 600, Topix – Goldman pic.twitter.com/mJCWNVLORD
— Sam Ro 📈 (@SamRo) April 24, 2021
It got almost as low as the bottom in the Topix in 2000 and lower than the STOXX Europe 600 has been since 1990. We think there will be a cyclical trend towards more competition. This is in line with the theme of lower margins. To be clear, there can be a short term cyclical improvement in margins along with a long term decline.
Conclusion
The housing market is very strong. There will be a long term cyclical upswing in building because America has a housing shortage. America has been underbuilding housing for a decade. Stocks aren’t in a bubble based on margin debt. Margin debt is up because stocks are up. Maybe there will be a correction, but there won’t be a large crash like in 2000 or 2008. American corporations are highly cash laden. There is extreme concentration in the American stock market. We don’t even have to name the stocks that are causing this concentration because they are ubiquitous.