Wolf Richter wolfstreet.com, http://www.amazon.com/author/wolfrichter
Besides that, rents are in free-fall in Chicago, decline in Seattle, plunge here, soar there, city by city.
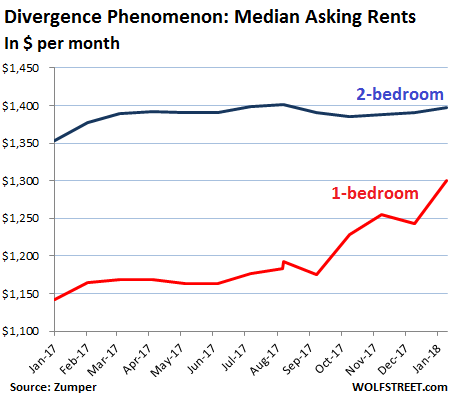
The peculiar phenomenon that had started last November is getting more and more peculiar. The momentum of median asking rents across the US has split in two: On a national average, one-bedroom rents are soaring in the double-digits while two-bedroom rents are barely ticking up. And this was exacerbated in February:
- Median 1-BR asking rent soared 11.7% from a year ago to $1,300.
- Median 2-BR asking rent rose only 1.5% from a year ago to $1,398.
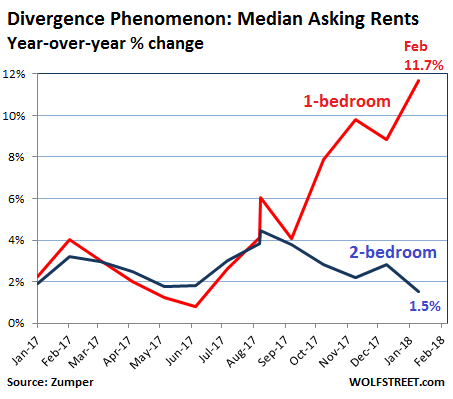
This divergence between the growth of 1-BR rents and 2-BR rents is occurring as 1-BR rents are rising faster or are declining more slowly, depending on the market, than 2-BR rents. In other words, starting in November, on average, the one-bedroom rental market has become a lot hotter or at least “less cold,” depending on the city, than the two-bedroom market, which is beginning to freeze over in many cities.
The reasons for this phenomenon remain unclear, but the guessing game has started. A top contender is simply the price level: Rents are too high, 2-BR rents have moved out of reach, and people are substituting and downsizing.
But rents are local, so to speak.
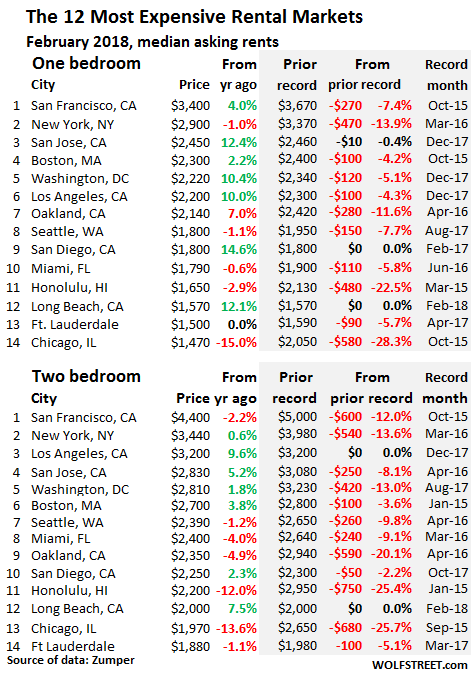
In San Francisco, the most expensive major rental market in the US, the median asking rent for 1-BR apartments rose 4% year-over-year to $3,400 in February, but is down 7.4% from the peak in October 2015. Median asking rent for 2-BR apartments fell 2.2% year-over-year to $4,400 and is down 12% from the peak in October 2015.
In New York City, the second most expensive major rental market, the median asking rent for 1-BR apartments fell 1% from a year ago to $2,900 and is down 13.9% from the peak in March 2016. For 2-BR apartments, it rose 0.6% to $3,440 but is down 13.6% from the peak in March 2016.
These asking rents do not include incentives or “concessions,” such as “1 month free” or “2 months free,” which reduce the effective rent for the first year by 8% or 17%. In New York City, concessions have reached record levels, according to Jonathan Miller, of Miller Samuel real estate appraisers, in his Housing Notes:
The key storyline across all three New York City was the record use of concessions. The market share of landlord concessions – inclusive of paid brokerage commissions, free rent, and other costs – was 49.3% in Manhattan, 47.5% in Brooklyn and 50.8% in the northwest region of Queens.
A special word about Chicago:
Back in September 2016, Chicago was the 8th most expensive rental market in the US. But its rents have plunged, and Chicago moved down the list (below). In recent months, it fell to 12th position. In February, it fell to 14th position with 1-BR rents and to 13th position with 2-BR rents, overtaken by Long Beach and Ft. Lauderdale. Chicago rents are in free-fall, if that can be said about a market that moves in months not minutes: 1-BR rents plunged 15% year-over-year to $1,470 and are down 28.3% from the peak in October 2015. 2-BR rents plunged 13.6% year-over-year to $1,970 and are down 25.7% from their peak in September 2015.
The data is based on asking rents in multifamily apartment buildings. Single-family houses and condos for rent are not included. Zumper gleans this data from active listings in cities across the country and aggregates it into its National Rent Report. Unlike some other types of rent reports, Zumper’s data includes asking rents from new construction.
In this table of the 14 most expensive rental markets, the shaded area indicates peak rents and the movements since then. Rents in all but two of the 14 markets were down significantly from their respective peaks. Note the number of double-digit declines. And look at the rents in formerly red-hot Seattle that is now drowning in high-end supply that the construction boom is dumping on the market: 2-BR rents are down 9.4% from their peak:
Other trouble spots among the most expensive markets.
In Honolulu, the 11th most expensive rental market, 1-BR asking rents, now at $1,650, have plunged 22.5% from their peak in March 2015. 2-BR rents, at $2,200, have plunged 25.4% from their peak in January 2015. This market has not yet found a bottom.
In Oakland, the 7th most expensive rental market and one of the destinations for San Francisco’s rent refugees, 1-BR rents, at $2,140, are down 11.6% from their peak in April 2016. And 2-BR rents, at $2,350, have plunged 20.1% from the peak in April 2016.
But asking rents are soaring by the double digits in many less-expensive metros, while they’re plunging in others to produce the national averages that hide most of the drama on the ground. Use the search function in your browser to look for a specific city in Zumper’s list of the 100 most expensive rental markets:
| City | 1 BR Rent | Y/Y % | 2 BR Rent | Y/Y % | |
| 1 | San Francisco, CA | $3,400 | 4.0% | $4,400 | -2.2% |
| 2 | New York, NY | $2,900 | -1.0% | $3,440 | 0.6% |
| 3 | San Jose, CA | $2,450 | 12.4% | $2,830 | 5.2% |
| 4 | Boston, MA | $2,300 | 2.2% | $2,700 | 3.8% |
| 5 | Washington, DC | $2,220 | 10.4% | $2,810 | 1.8% |
| 6 | Los Angeles, CA | $2,200 | 10.0% | $3,200 | 9.6% |
| 7 | Oakland, CA | $2,140 | 7.0% | $2,350 | -4.9% |
| 8 | San Diego, CA | $1,800 | 14.6% | $2,250 | 2.3% |
| 8 | Seattle, WA | $1,800 | -1.1% | $2,390 | -1.2% |
| 10 | Miami, FL | $1,790 | -0.6% | $2,400 | -4.0% |
| 11 | Honolulu, HI | $1,650 | -2.9% | $2,200 | -12.0% |
| 12 | Long Beach, CA | $1,570 | 12.1% | $2,000 | 7.5% |
| 13 | Fort Lauderdale, FL | $1,500 | 0.0% | $1,880 | -1.1% |
| 14 | Chicago, IL | $1,470 | -15.0% | $1,970 | -13.6% |
| 15 | Atlanta, GA | $1,460 | 8.1% | $1,870 | 10.0% |
| 16 | Denver, CO | $1,430 | 14.4% | $1,890 | 14.5% |
| 17 | Philadelphia, PA | $1,400 | 3.7% | $1,560 | 1.3% |
| 18 | Scottsdale, AZ | $1,360 | 13.3% | $2,120 | -7.8% |
| 19 | Portland, OR | $1,330 | -2.2% | $1,560 | -1.9% |
| 19 | Providence, RI | $1,330 | -7.0% | $1,370 | -8.1% |
| 21 | Minneapolis, MN | $1,320 | -2.2% | $1,760 | 1.7% |
| 22 | New Orleans, LA | $1,300 | -9.1% | $1,340 | -15.7% |
| 23 | Dallas, TX | $1,280 | -1.5% | $1,700 | -2.9% |
| 24 | Baltimore, MD | $1,260 | 14.5% | $1,490 | 15.5% |
| 24 | Houston, TX | $1,260 | 4.1% | $1,550 | 3.3% |
| 26 | Nashville, TN | $1,250 | 7.8% | $1,370 | 5.4% |
| 27 | Sacramento, CA | $1,210 | 15.2% | $1,360 | 13.3% |
| 28 | Charlotte, NC | $1,200 | 7.1% | $1,250 | 1.6% |
| 28 | Irving, TX | $1,200 | 12.1% | $1,480 | 8.8% |
| 30 | Orlando, FL | $1,190 | 15.5% | $1,320 | 10.0% |
| 31 | Austin, TX | $1,180 | 9.3% | $1,470 | 5.8% |
| 32 | Tampa, FL | $1,150 | 13.9% | $1,280 | 5.8% |
| 33 | Madison, WI | $1,140 | -0.9% | $1,300 | 1.6% |
| 34 | Gilbert, AZ | $1,130 | 14.1% | $1,350 | 6.3% |
| 34 | Plano, TX | $1,130 | 7.6% | $1,510 | 7.1% |
| 36 | Chandler, AZ | $1,110 | 14.4% | $1,240 | 6.9% |
| 37 | Aurora, CO | $1,080 | 5.9% | $1,340 | 3.1% |
| 37 | Henderson, NV | $1,080 | 13.7% | $1,150 | 4.5% |
| 39 | Newark, NJ | $1,050 | 10.5% | $1,250 | 5.0% |
| 39 | Virginia Beach, VA | $1,050 | 6.1% | $1,150 | 0.9% |
| 41 | Fort Worth, TX | $1,010 | 8.6% | $1,240 | 12.7% |
| 41 | Richmond, VA | $1,010 | 3.1% | $1,150 | 9.5% |
| 43 | Pittsburgh, PA | $1,000 | -8.3% | $1,220 | -4.7% |
| 44 | Chesapeake, VA | $990 | 3.1% | $1,200 | 5.3% |
| 45 | Durham, NC | $980 | 10.1% | $1,110 | 9.9% |
| 46 | Raleigh, NC | $970 | -3.0% | $1,150 | 1.8% |
| 46 | Salt Lake City, UT | $970 | 15.5% | $1,200 | 7.1% |
| 46 | St Petersburg, FL | $970 | 14.1% | $1,540 | 14.1% |
| 49 | Phoenix, AZ | $960 | 14.3% | $1,100 | 7.8% |
| 50 | Buffalo, NY | $940 | 4.4% | $1,100 | -11.3% |
| 50 | Jacksonville, FL | $940 | 14.6% | $1,050 | 1.9% |
| 52 | Fresno, CA | $930 | 9.4% | $1,000 | 5.3% |
| 52 | Kansas City, MO | $930 | 2.2% | $990 | 3.1% |
| 54 | Mesa, AZ | $910 | 13.8% | $960 | 1.1% |
| 55 | Las Vegas, NV | $900 | 15.4% | $1,000 | 7.5% |
| 56 | Syracuse, NY | $890 | 12.7% | $940 | -6.0% |
| 57 | Louisville, KY | $880 | 15.8% | $930 | 14.8% |
| 58 | Anchorage, AK | $870 | -6.5% | $1,110 | 0.9% |
| 58 | San Antonio, TX | $870 | 1.2% | $1,100 | 0.9% |
| 60 | Baton Rouge, LA | $860 | -1.1% | $900 | -10.0% |
| 61 | Boise, ID | $850 | 4.9% | $950 | -3.1% |
| 61 | Corpus Christi, TX | $850 | 4.9% | $1,060 | 14.0% |
| 63 | Milwaukee, WI | $840 | 6.3% | $940 | 4.4% |
| 64 | Colorado Springs, CO | $830 | 3.8% | $1,000 | 0.0% |
| 65 | Omaha, NE | $810 | 15.7% | $920 | 2.2% |
| 66 | Bakersfield, CA | $800 | 9.6% | $860 | 7.5% |
| 66 | Reno, NV | $800 | 15.9% | $1,180 | 12.4% |
| 68 | Cincinnati, OH | $790 | 8.2% | $1,020 | 7.4% |
| 68 | Glendale, AZ | $790 | 14.5% | $860 | -1.1% |
| 68 | Lexington, KY | $790 | 1.3% | $930 | 0.0% |
| 71 | Chattanooga, TN | $780 | 11.4% | $820 | 9.3% |
| 71 | Rochester, NY | $780 | 14.7% | $980 | 15.3% |
| 73 | Knoxville, TN | $760 | 13.4% | $830 | 3.8% |
| 76 | Des Moines, IA | $720 | -8.9% | $760 | -10.6% |
| 74 | Laredo, TX | $750 | -2.6% | $900 | -1.1% |
| 75 | Arlington, TX | $730 | 7.4% | $970 | 7.8% |
| 77 | Augusta, GA | $710 | 12.7% | $750 | -5.1% |
| 77 | Cleveland, OH | $710 | 10.9% | $760 | 7.0% |
| 77 | Oklahoma City, OK | $710 | 14.5% | $780 | 4.0% |
| 77 | St Louis, MO | $710 | 2.9% | $1,010 | 5.2% |
| 77 | Tallahassee, FL | $710 | 9.2% | $790 | 3.9% |
| 77 | Tucson, AZ | $710 | 14.5% | $800 | 1.3% |
| 83 | Norfolk, VA | $700 | 7.7% | $900 | 2.3% |
| 84 | Greensboro, NC | $690 | 15.0% | $800 | 3.9% |
| 84 | Spokane, WA | $690 | 6.2% | $910 | 12.3% |
| 86 | Winston Salem, NC | $670 | -4.3% | $720 | -2.7% |
| 87 | Indianapolis, IN | $660 | 15.8% | $720 | 5.9% |
| 88 | Columbus, OH | $640 | 0.0% | $950 | 4.4% |
| 89 | El Paso, TX | $630 | 0.0% | $740 | -1.3% |
| 89 | Memphis, TN | $630 | 14.5% | $690 | 11.3% |
| 89 | Tulsa, OK | $630 | 12.5% | $730 | -1.4% |
| 92 | Albuquerque, NM | $620 | 3.3% | $800 | 3.9% |
| 93 | Shreveport, LA | $580 | 1.8% | $620 | -7.5% |
| 93 | Lincoln, NE | $580 | -14.7% | $770 | -6.1% |
| 93 | Lubbock, TX | $580 | 5.5% | $730 | 7.4% |
| 96 | Wichita, KS | $570 | 14.0% | $660 | 0.0% |
| 97 | Akron, OH | $560 | 5.7% | $670 | 3.1% |
| 97 | Toledo, OH | $560 | 14.3% | $640 | 14.3% |
| 99 | Detroit, MI | $530 | 0.0% | $600 | -3.2% |
| 100 | Fort Wayne, IN | $510 | 6.3% | $580 | 5.5% |