The tech run has been incredible over the past few years. The concentration in market cap in the $FAANG stocks in particular have been subject to much discussion and speculation. Too much power in the hand of the few? Invincible. Unstoppable.
Then came 2018 and tech rolled over hard in Q4 with the rest of the market and a much needed correction took place. Then a furious recovery took place in 2019 inspired by a suddenly easy Fed and $FAANG stocks again outperformed the market.
Many are again up strongly for the year including $AMZN, currently up 20% year to date with the holiday season just a few months away, a key time for retailers including $AMZN.
Yet the price action in $AMZN is leaving a few footprints that raise eyebrows. Indeed it’s a bit of a mystery, a mystery that may have profound implication for the broader market.
Perhaps the most pertinent question: Is $AMZN putting in a yearly double top on the chart?

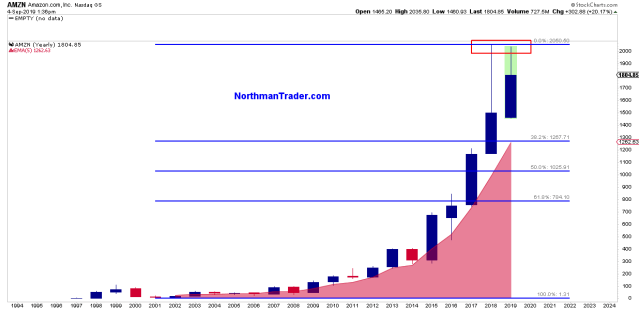
I’m using a linear chart on the yearly to highlight 2 points:
A. Like many big cap tech stocks $AMZN has had an incredible run over the past 10/11 years. Even last year’s drubbing didn’t produce a down year. However it did produced a major year reversal candle.
B. Note that during the big correction last year $AMZN never reconnected with its yearly 5 EMA and this year too it remains vastly disconnected. Note reconnects are the norm, but haven’t been during these past couple of years. That may be a technical problem for $AMZN down the road as reconnects happen in normal markets, even for $AMZN. It’s now on its second year of no reconnect. Price is currently 42% above the yearly 5 EMA. Ironically we can note that the .382 fib to its 2001 lows resides in its vicinity offering perhaps technical confluence.
Now I’m not saying $AMZN is going to drop to 1262 any time soon, but last year’s sharp reversal surely shows that moves of this size can happen quickly.
So is this a double top? Unknowable until the year is out. If markets can break higher inspired by central banks intervention I suppose $AMZN can make new highs still and invalidate this premise.
But there’s more to the picture than just a yearly view.
Here’s a weekly view:

Ouch. In 2018 $AMZN formed a tightening rising wedge which broke to the downside and resulted in the big correction. The 2019 recovery then formed a second wedge to form a lower high and that wedge then broke down too in August.
Note price has been basing above the weekly 50MA, which could be viewed as a base from which to rally higher, but note also the weekly MACD is pointing south hard. It is showing signs of possible improvement which can lead to a bounce, but also note how the MACD high in 2019 was significantly lower than the one in 2018 suggesting a lot less momentum and strength for the 2019 rally versus the 2018 one.
How significant is that? Let’s look at the daily chart:

The daily chart shows that the 2019 high was within a stone’s throw of the 2018 highs, highlighting how negatively divergent the weekly MACD has been on the move in July. Prime Day was the excitement driver for that high.
But since then $AMZN has been weak and like the 50MA on the weekly chart the daily 200MA is currently providing support. So you see the price consolidation in this vicinity makes perfect sense.
Is this a bear flag on $AMZN? If it is the stock is at risk of another sizable down leg to come which then would amplify the risk of a yearly double top to confirm.
As of this writing $SPX is much closer than $AMZN to break out of its recent consolidation range to the upside which highlights an interesting divergence that has been building for some time.
$AMZN is suddenly lagging despite its year to date gain of 20%. It was a leader in 2019, it is not now on a relative basis. How do we know?
Well, September over September $SPX is basically flat:
https://twitter.com/NorthmanTrader/status/1168924663398969346
But guess what? $AMZN is not. Last September $AMZN was trading at $2000, now it’s trading at $1800, a 10% haircut in relative performance.
What’s that signaling? That perhaps things are a lot more nuanced than they seem. And perhaps consumer confidence data yields a hint. While the consumer is heralded as still holding the US economy up there are signs of concern with a sudden drop off in August:

A sentiment that CEO’s not only share, but are leading to the downside:

And note that July peak in $AMZN coincides with economic sentiment as well. Things have turned south since then and so has $AMZN.
As I’ve stated this weekend much will depend on the outcomes of key events this month. If things break higher $AMZN can target the 1877 area, its 50MA. It’s a critical level to exceed and defend as support, without it $AMZN remains at high risk of placing a yearly double top which would well spell further trouble into 2020.
As long as the stock can defend its weekly 50MA and 200MA support confluence it has a shot at averting that fate, but beware, a sustained break below those in context of a weak and divergent MACD and a broken rising wedge may make a visit toward the yearly 5 EMA either this year or next a forgone conclusion. $AMZN, in my view, remains a key stock to watch.