
The Importance of Asset Classes
Asset allocation is one of the most important decisions an investor can make. In fact, studies have found that the percentage of each asset type held in a portfolio is a bigger contributor to returns than individual security selection.
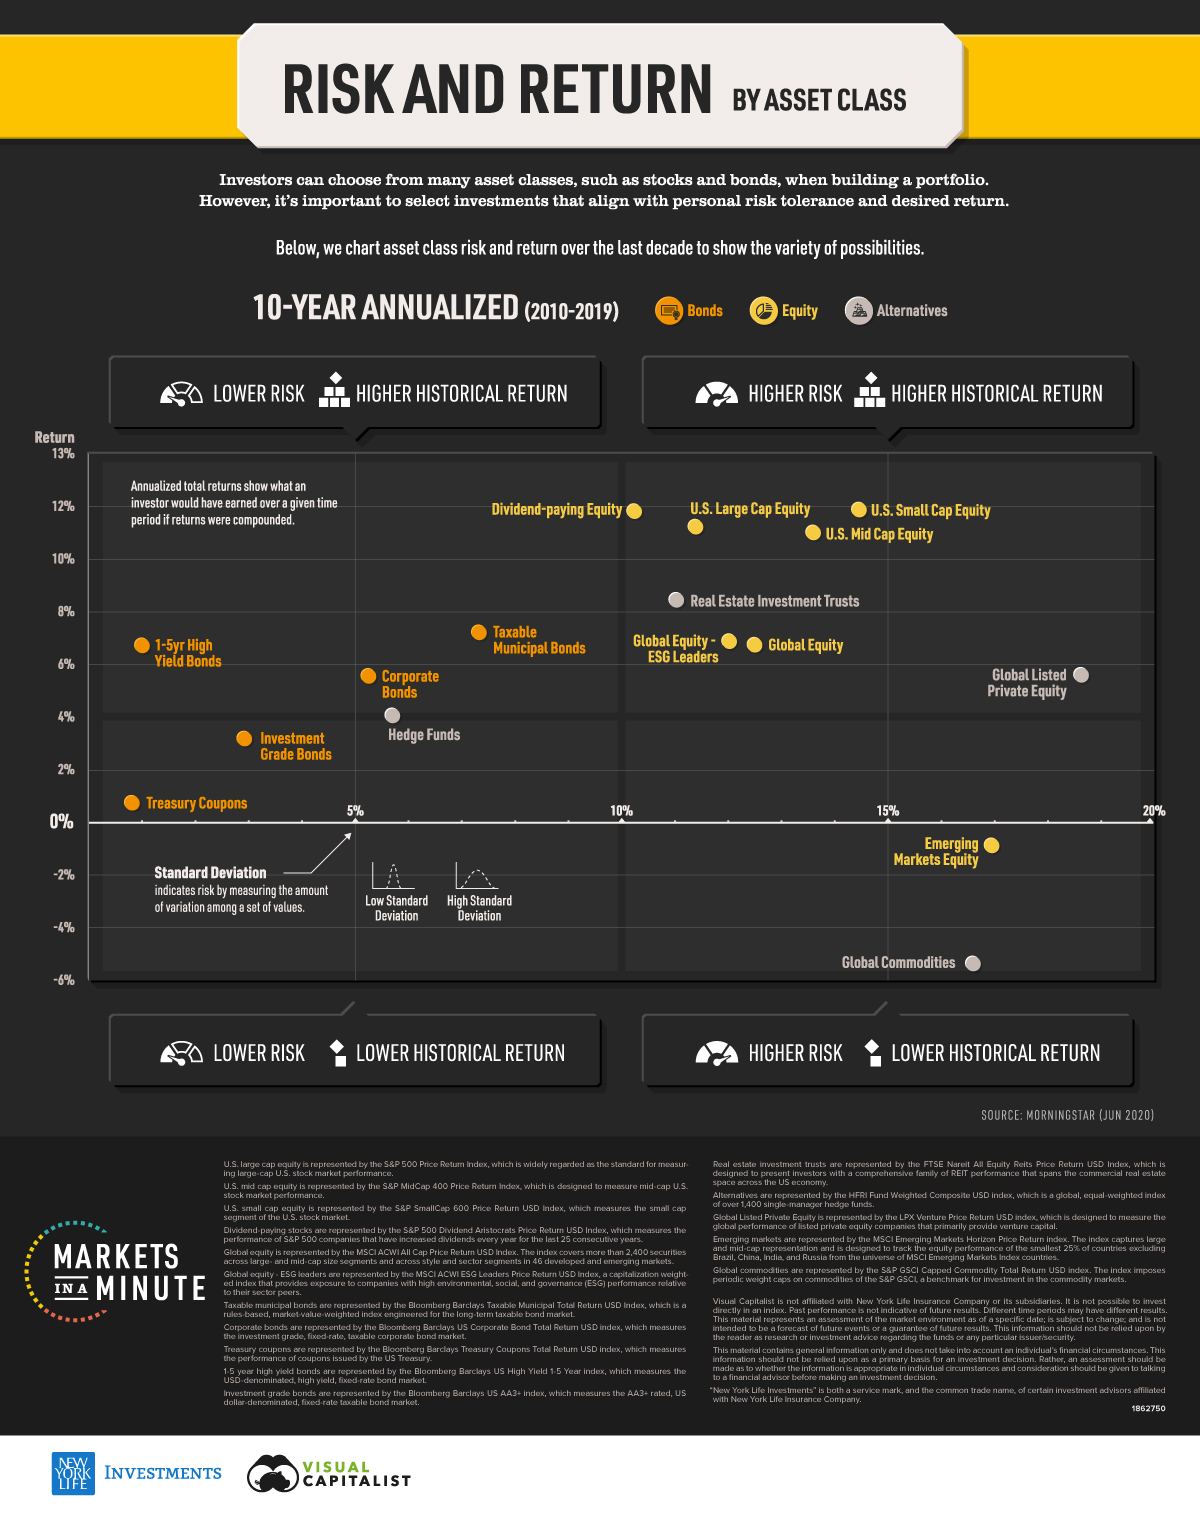
However, it’s important for investors to select asset classes that align with their personal risk tolerance—which can differ based on how long they plan to hold an investment—and their targeted returns. This Markets in a Minute chart from New York Life Investments shows asset class risk and return data from 2010-2019 to highlight their different profiles.
Asset Class Risk and Return
To measure risk and return, we took annualized return and standard deviation data over the last ten years.
Annualized returns show what an investor would have earned over a timeframe if returns were compounded. It is useful because an investment’s value is dependent on the gains or losses experienced in prior time periods. For example, an investment that lost half of its value in the previous year would need to see a 100% return to break even.
Standard deviation indicates risk by measuring the amount of variation among a set of values. For example, equities have historically seen a wide range in returns, meaning they are more volatile and carry more risk. On the other hand, treasuries have typically seen a smaller range in returns, illustrating lower volatility levels.
Below is the risk and return for select asset classes from 2010-2019, organized from lowest return to highest return.
| Asset Class | Annualized Return | Annualized Standard Deviation |
|---|---|---|
| Global Commodities | -5.38% | 16.60% |
| Emerging Markets Equity | -0.89% | 16.95% |
| Treasury Coupons | 0.73% | 0.81% |
| Investment Grade Bonds | 3.17% | 2.92% |
| Hedge Funds | 4.05% | 5.70% |
| Corporate Bonds | 5.55% | 5.26% |
| Global Listed Private Equity | 5.59% | 18.63% |
| 1-5yr High Yield Bonds | 6.71% | 1.00% |
| Global Equity | 6.75% | 12.50% |
| Global Equity – ESG Leaders | 6.87% | 12.03% |
| Taxable Municipal Bonds | 7.20% | 7.33% |
| Real Estate Investment Trusts | 8.44% | 11.03% |
| U.S. Mid Cap Equity | 11.00% | 13.60% |
| U.S. Large Cap Equity | 11.22% | 11.39% |
| Dividend-Paying Equity | 11.81% | 10.24% |
| U.S. Small Cap Equity | 11.87% | 14.46% |
Note: See the bottom of the graphic for the specific indexes used.
Global commodities saw the lowest return over the last 10 years. Plummeting oil prices, and an equities bull market that left little demand for safe haven assets like precious metals, likely contributed to the asset class’ underperformance.
Backed by the U.S. federal government, Treasury coupons had the lowest volatility but also saw a relatively low return of 0.73%. In contrast, 1-5 year high yield bonds generated a return of 6.71% with only slightly more risk.
With the exception of emerging market equity, all selected equities had higher risk and relatively higher historical returns. Among the stocks shown, dividend-paying equity saw the highest returns relative to their risk level.
Building a Portfolio
As they consider asset class risk and return, investors should remember that historical performance does not indicate future results. In addition, the above data is somewhat limited in that it only shows performance during the recent bull market—and returns can vary in different stages of the market cycle. For example, commodities go through multi-decade periods of price ascent and decline known as super cycles.
However, historical information may help investors gauge the asset classes that are best suited to their personal goals. Whether an investor needs more stability to help save for a near-term vacation, or investments with higher return potential for retirement savings, they can build a portfolio tailored to their needs.