by UPFINA
The September PCE report was very good because yearly real consumer spending growth improved, real income growth improved, and the core inflation rate fell. The consumer was a big driver of Q3’s GDP report. Since income growth improved and the savings rate increased, there’s room for the consumer to increase spending growth further in the all-important holiday shopping season. The Fed has relied on core PCE inflation being below its 2% target to cut rates 3 times in 2019. You’d think inflation would be high after a 10 year expansion, but it hasn’t been above 2% since September 2018. The Fed ignores core CPI inflation which has been above 2%. It’s tough to fully criticize the Fed for that though because headline CPI and headline PCE inflation have been modest because of weak energy inflation.
Solid Income & Spending Growth
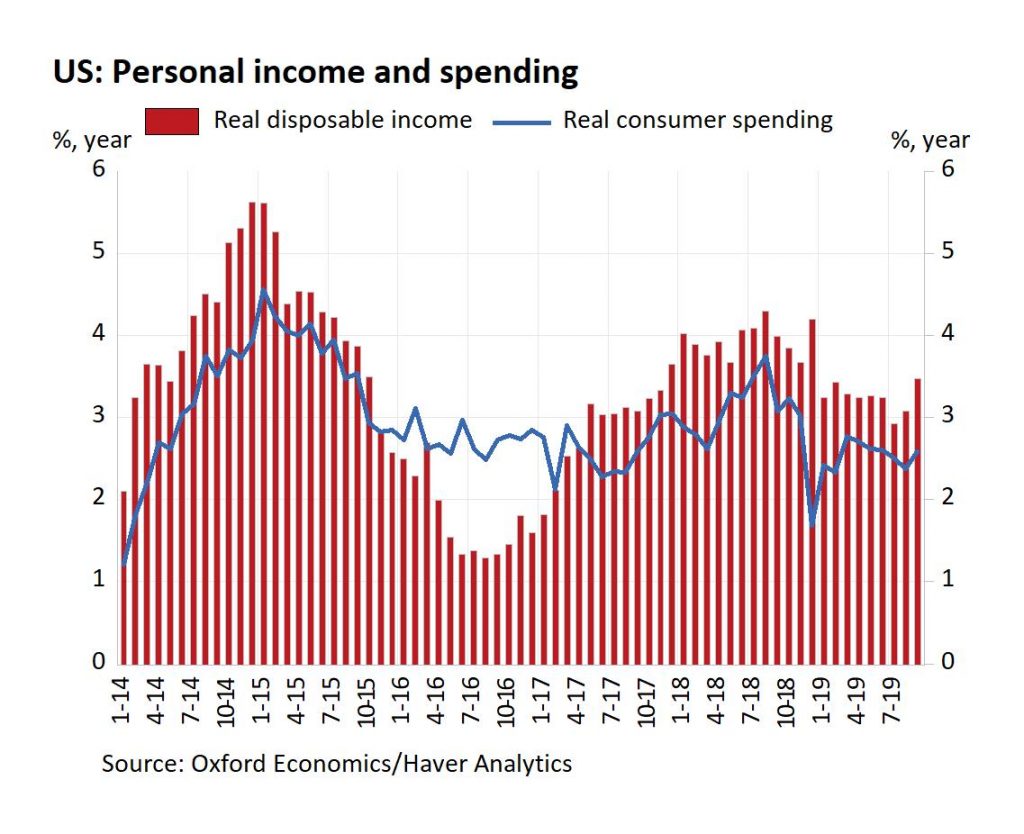
September’s monthly personal income growth was 0.3%; August’s reading was revised up to 0.5% from 0.4%. It’s nice when a reading meets estimates even though its comp got tougher. Essentially, the threshold for monthly growth estimates to be hit was harder unless the upward revision was baked into the consensus. Wages and salaries monthly growth was 0%, but that followed 0.6% growth in August. Yearly, real disposable income growth improved from 3.08% to 3.48%. As you can see from the chart below, it was above real consumption growth again.

The consumer is saving more as the savings rate improved to 8.3% from 8.1%. As you can see from the chart below, that’s the highest rate since March 2019.
https://t.co/QutsoqndRq pic.twitter.com/0N9jm7ql93
— Logan Mohtashami (@LoganMohtashami) October 31, 2019
If the consumer becomes more confident, there could be a huge burst in spending because there’s room to lower the savings rate. This confidence could come from the recent rise in stocks or the completion of phase one of the trade deal. If the savings rate declines, there could be a big increase in spending during the all-important holiday shopping season. It’s great to see real yearly personal income growth increase for the second straight month. Growth was the highest since December 2018. The 2 year growth stack increased slightly because last year growth rate fell from 4.3% to 3.99%. This reinforces the strength in this reading.
August’s monthly consumer spending growth was revised from 0.1% to 0.2%. September’s monthly growth met estimates of 0.2% even though the prior month was revised higher just like income growth. The monthly spending growth rates on durables, non-durables, and services were 0.4%, -0.1%, 0.2%. Headline PCE yearly growth increased from 3.85% to 3.95%. Real yearly consumption spending growth improved to 2.6%. There is room for it to increase more as we discussed.
Inflation Falls, Supporting The Fed’s Rate Cuts
The Fed has been allowed to cut rates in this slowdown even though the expansion is over 10 years old because of low inflation. Despite the decent wage growth, core inflation has stayed below 2%. Specifically, headline monthly PCE inflation was 0% which met estimates and was the same as last month. Headline yearly PCE inflation fell from 1.4% to 1.33%. That missed estimates for 1.4%.
Core PCE inflation was 0% monthly which missed estimates for 0.1% and August’s 0.1%. Yearly core PCE inflation was 1.67% which fell from 1.77% and met estimates for 1.7% on a rounded basis. The Fed’s core PCE target is 2%. It has been below 2% since last October. The decline in core PCE inflation was significant because last year’s comp was steady at 2%. No comp change and a yearly growth decline means the 2 year growth stack fell.
As we mentioned earlier, core PCE has been below core CPI. As you can see from the chart below, the difference between the 2 rates has increased to 0.69%. That’s the highest difference since early 2016.
Spread between core CPI (2.4% y/o/y) & core PCE (1.7% y/o/y) in Sept is widest since June '16. Biggest portion of PCE is healthcare where Medicare/Medicaid reimbursement rates are artificially set low by the Gov't. CPI measures out of pocket healthcare expenses. Fed ignores CPI. pic.twitter.com/fqItKAhYLI
— Peter Boockvar (@pboockvar) October 31, 2019
The current difference stems from healthcare inflation as we mentioned in a previous article. Headline CPI was only 1.72%. That makes criticisms of the Fed a bit over the top. Yes, the Fed has chosen a metric of inflation which rarely rises above 2%, but in this case that’s not as problematic because headline inflation is low anyway.
Job Cuts Increase 21% In October
The jobless claims report from the week of October 26th was strong again as claims increased from 213,000 to 218,000. Claims aren’t falling anymore, but being close to a record low when adjusted for population is still great.
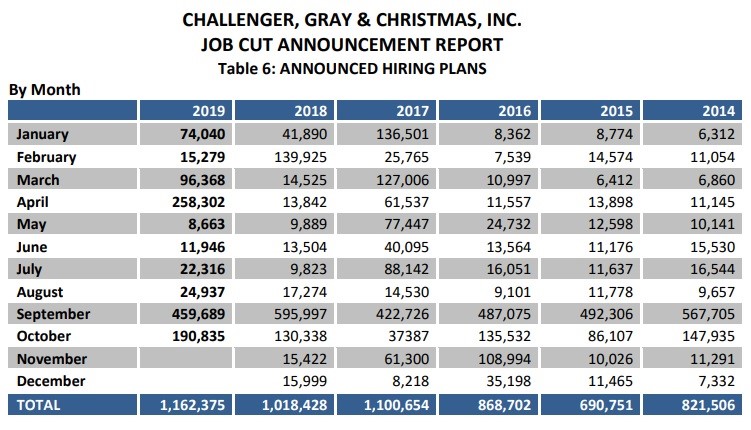
In October, the number of job cut announcements rose from 41,557 to 50,275 sequentially. This is 33.5% below October 2018’s job cuts. More importantly, there have been 515,441 job cuts this year which is up from the 441,702 cuts in the first 10 months of last year (16.6% increase). That’s the highest total since 2015. There were 15,898 cuts in tech as HP announced it would cut 9,000 jobs by 2022. The auto industry has had 43,025 job cuts which is up from 14,489 in the first 10 months of last year. The table below shows the number of hires per month. There have been more hires in 2019 than 2018 even though this year has 2 months left.
Earnings Update
With 345 S&P 500 firms reporting earnings, 75% have beaten EPS estimates and 60% have beaten sales estimates. Non-GAAP EPS growth is 3.88% and sales growth is 5.39%. The table below shows the blended growth rate which is why it’s different.
Here are the updated $SPY EPS (not #earnings ) growth expectations. pic.twitter.com/eiJILNwhjl
— The Earnings Scout (@EarningsScout) October 31, 2019
EPS growth will be positive again in Q3, but barely. More importantly, Q4 growth is expected to be 3.04%. At this point last quarter, Q3 growth was expected to be -0.26%. This implies Q4 growth will be higher. It should be because the comp is much easier.