- Bull Run Reaches Exhaustion
- Sector & Market Analysis
- 401k Plan Manager
On Tuesday, we discussed a very important point with respect to the bull run so far.
“Despite the underlying economic and fundamental data, the markets have surged back to extremely overbought, extended, and deviated levels. The chart table below is published weekly for our RIA PRO subscribers (use code PRO30 for a 30-day free trial)”

“You will note that with the exception of bond prices, every market and sector is more than 5% above its 50-day moving average and year-to-date performance is pushing more historic extremes both in price and in extreme overbought conditions.
Those overbought conditions are more prevalent in the chart below. On virtually every measure, markets are suggesting the fuel for an additional leg higher in assets prices is extremely limited.”
Let me explain why this is important for investors to understand.
While it is true that there is always a buyer and seller in every transaction it is the “supply and demand” of those buyers and sellers at a particular price point which affects the overall price.
For example, imagine two rooms of 100 individuals each that want to buy shares of ABC stock. Room “A” has 100 individuals who currently own ABC stock and Room “B” has 100 individuals with cash wanting to buy shares of ABC. The table below shows a very simplistic model of this process.
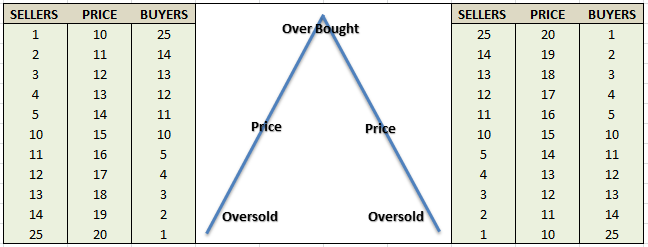
At $10 a share, there are numerous buyers but very few sellers. The demand for the shares drives the price higher which entices more sellers. As long as the demand for shares outpaces the supply of sellers – the price is pushed higher. However, at some point, the price reaches a level that exhausts the supply of buyers. The next price decline occurs as sellers must begin lowering prices to attract buyers.
So, yes, while there is “always a buyer for every seller” the question is always “at what price.” The chart below is a short-term view of the market which illustrates the current backdrop.
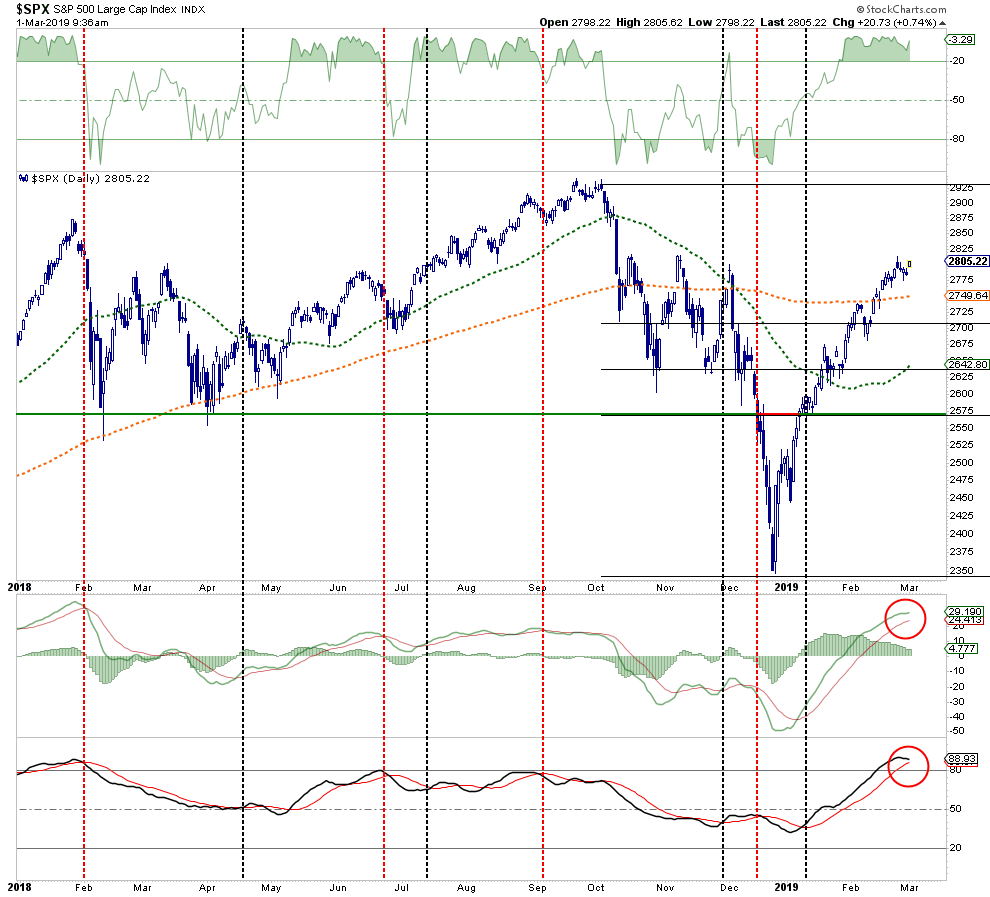
The chart below shows several methods I look at to try and determine if buyers are potentially reaching a point of “exhaustion” which might lead to a price reversal in the short-term. The top of the chart looks at the historical deviation between the price of the market as compared to the 200-dma. The bottom 4-indicators are measures of price movement and participation (The bottom two panels are the number of stocks above the 50 and 200-dma.)
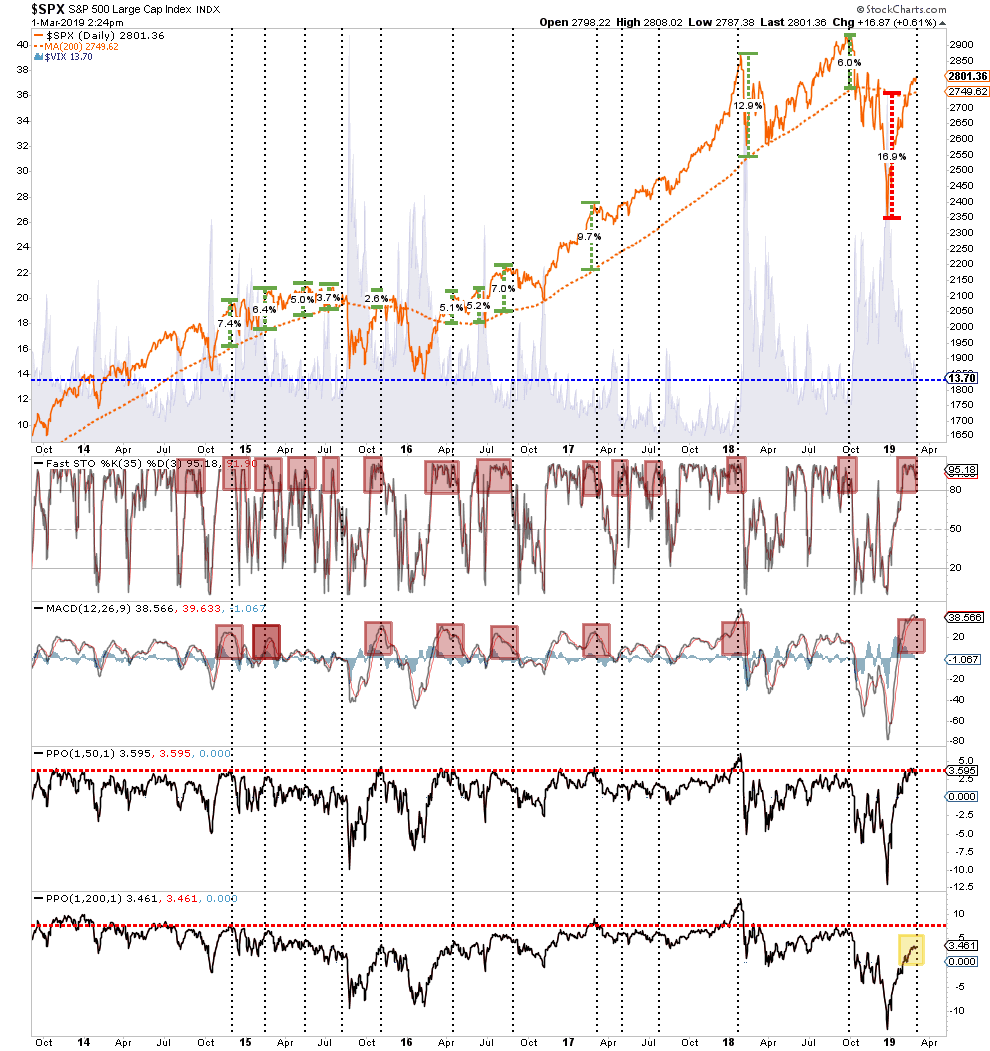
Don’t get too hung up on trying to understand all the nuances of the chart. The important point, from a money management standpoint, is the determination of the potential risk/reward opportunity for allocating capital to the markets at any given time.
As a portfolio manager, clients tend “not to like” having their capital invested in the markets only to almost immediately suffer a principal loss. By using some measures to determine the current risk/reward outcome, the deployment of capital can be more effectively timed.
While the majority of the chart (except for stocks above their 200-dma) is suggesting the market has reached levels where buyers have been more reticent, it is important to understand that just because the indicator has reached an extreme level – the market will not necessarily fall apart immediately. It is a warning sign that suggests further upside in the market is relatively limited compared to the downside risk which currently exists.
The average correction that resolved the overbought condition, since the end of the last financial crisis, has been as little as -3% but as much as -20%.
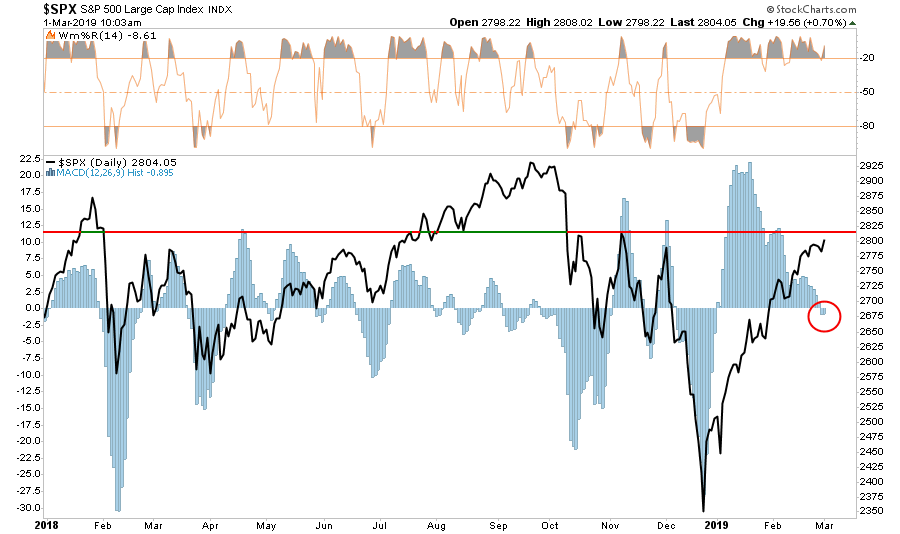
The chart below is a much shorter-term analysis which essentially shows the same thing. With markets currently on a very short-term sell-signal, and overbought, the risk/reward isn’t exactly compelling.
As I discussed in “Visualizing Bob Farrell’s 10 Investing Rules:”
“Like a rubber band that has been stretched too far – it must be relaxed before it can be stretched again. It is the same for stock prices which are anchored to their moving averages. Trends that get overextended in one direction, or another, always return to their long-term average. Even during a strong uptrend or strong downtrend, prices often move back (revert) to a long-term moving average.”

The chart below shows the S&P 500 with a 50- and 200-day moving average. The bottom of the chart shows two different measures of price momentum over differing time spans.
What is important to notice is that when the markets have gotten this extended previously, it has generally been a better opportunity to reduce portfolio risk (take profits, rebalance risk) rather than expanding it.
This all supports the statement I made on Tuesday:
“The markets are not immune to the ‘laws of physics.’ While the price action is indeed bullish in the short-term, the shorter-term moving averages act like ‘gravity’ on prices. Given the current extension and deviation above the 50-dma the odds of a pullback, before a continued advance, is a high probability.
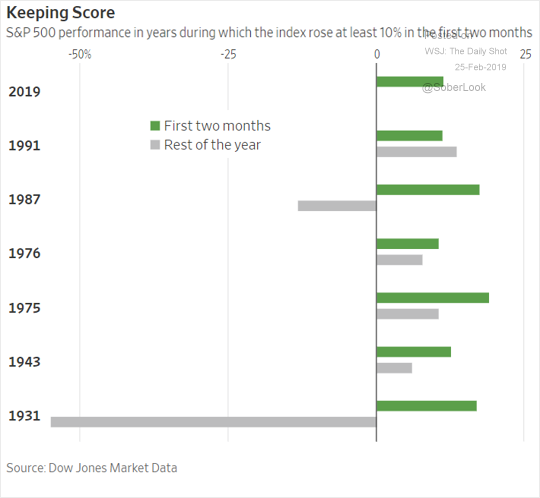
As shown in the table below, it is very likely that if you sold everything today, and went to cash, that you would miss little over the balance of the year. In other words, the bulk of the gains have likely been made for the year.”
“What? I might miss out on a move higher?”
This is a true statement, but at what risk?
Let’s think about why stocks are rising at the moment?
A potential trade deal with China?
Maybe, but we have known about that since December when the markets started rallying.
A more dovish Fed?
Okay, but we have also known about that for the last two months.
But the list of what’s NOT supporting the market’s advance continues to grow.
- Earnings estimates for 2019 have sharply collapsed as I previously stated they would and still have more to go.
- Stock market targets for 2019 are way too high as well.
- Rising geopolitical tensions between India, Pakistan, Russia, China, Iran, etc.
- The effect of the tax cut legislation has disappeared as year-over-year comparisons are reverting back to normalized growth rates.
- Economic growth is slowing.
- Chinese economic data has weakened further.
- European growth, already weak, continues to weaken.
- Valuations have returned to expensive levels.
- Stocks are technically very stretched as noted above.
- Long-term technical signals remain negative.
- An uptick in the unemployment rate and rising continued jobless claims.
- Clear stress on the consumption side of the equation from a sharp slow down in retail sales and personal consumption combined with a sharp uptick in the savings rate.
“As you all know, I couldn’t disagree more with the notion of an efficient market nor that price is truth. Emotion, liquidity, sentiment, positioning and the machines and algos are some of the many factors that create an artificiality in stock prices and run counter to natural price discovery.
How else to explain the recent 450 handle rise in the S&P Index? And the similar drop from September to December, 2018?
Our job (or at least how I implement my strategy) is to develop a sense of fair market value or intrinsic value against the current price level for stocks. When the gap widens (and prices are substantially lower than that calculated value) I buy… and vice versa.”
Or simply:
“Price is what you pay, value is what you get.” – Warren Buffett
In the short-term the markets can certainly remain extended for much longer than logic would predict, however, they can not stay overly extended indefinitely.
The important point here is simply this.
While the Fed’s dovish U-turn may have curtailed the 2018 bear market for now, the market is operating under the assumption the Fed has the same ability to support the financial markets as they did previously.
The problem is the environment today is vastly different than it was in 2008-2009.
- Unemployment is 4%, not 10+%
- Jobless claims are at historic lows, rather than historic highs.
- Consumer confidence is optimistic, not pessimistic.
- Corporate debt is a record levels and the quality of that debt has deteriorated.
- The government is already running a $1 trillion deficit in an expansion not half that rate as prior to the last recession.
- The economy is extremely long is a growth cycle, not emerging from a recession.
- Pent up demand for houses, cars, and other durables has been absorbed and is starting to decline.
- Production and Services measures recently peaked, not bottomed.
In other words, the world is exactly the opposite of what it was when the Fed launched “monetary accommodation” previously. Logic suggests that such an environment will make further interventions by the Fed substantially less effective.
The only question is how long will it take the markets to figure it out?
Summary
Investing is alway about measuring risk versus reward. Currently, the risk to investors is a correction over the next couple of months followed by a rally into year end which culminates in a total return which is LESS than where you are today.
I know. That is a hard concept to grasp when the media is telling you to NOT ONLY stay invested, but “buy more” as the “bull market is back.”
I can’t disagree that the long-term trend of the market remains bullish, which is why we continue to have portfolios allocated toward equity risk, but markets do not go straight up indefinitely. There will be a correction of some magnitude in the near future which will allow for a safer entry of new capital into the markets.
Patience, however, will likely be tested before that opportunity presents itself.
Let me reiterate what we wrote two weeks ago:
“The important point here is that from a contrarian standpoint, markets have gotten way ahead of the underlying fundamentals. While the market may indeed end the year on a higher note, it will most likely not do that without lower prices first.
Statements like these are always misinterpreted to mean that we are ‘bearish,’ hiding in cash, and have 6-cases of spam and a carton of Twinkies sitting on our desk.”
Our job as investors, and portfolio managers, is to navigate the market, capitalize on opportunity when it is available, and preserve capital when risks exceed our thresholds.
Currently, risk exceeds our threshold.
That is why we have once again added short-positions to our long-portfolios, closed out trading positions with nice profits, and are simply willing to wait for the next good opportunity to put capital at risk.
See you next week.