Yikes!
The Federal Reserve continues to print money at a historic high rate and with it we get an epic asset bubble as demonstrated by the Buffett Indicator (Stock Market/GDP) plotted against M2 Money.
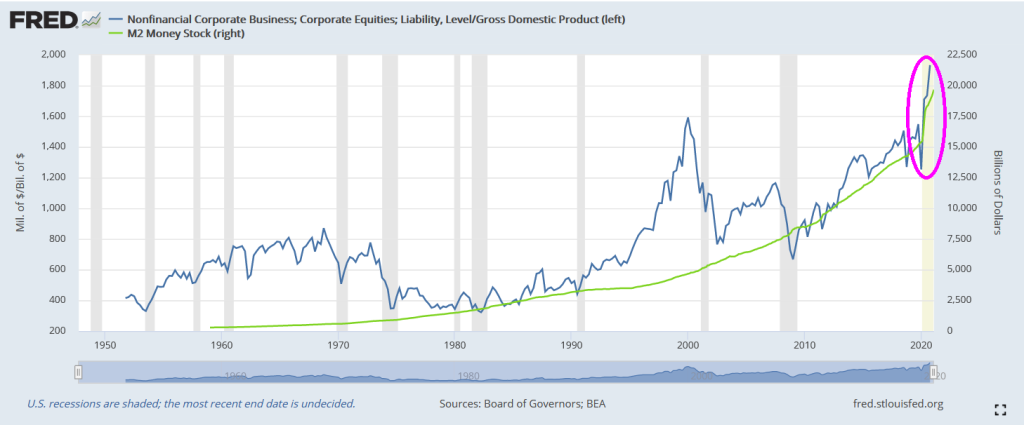
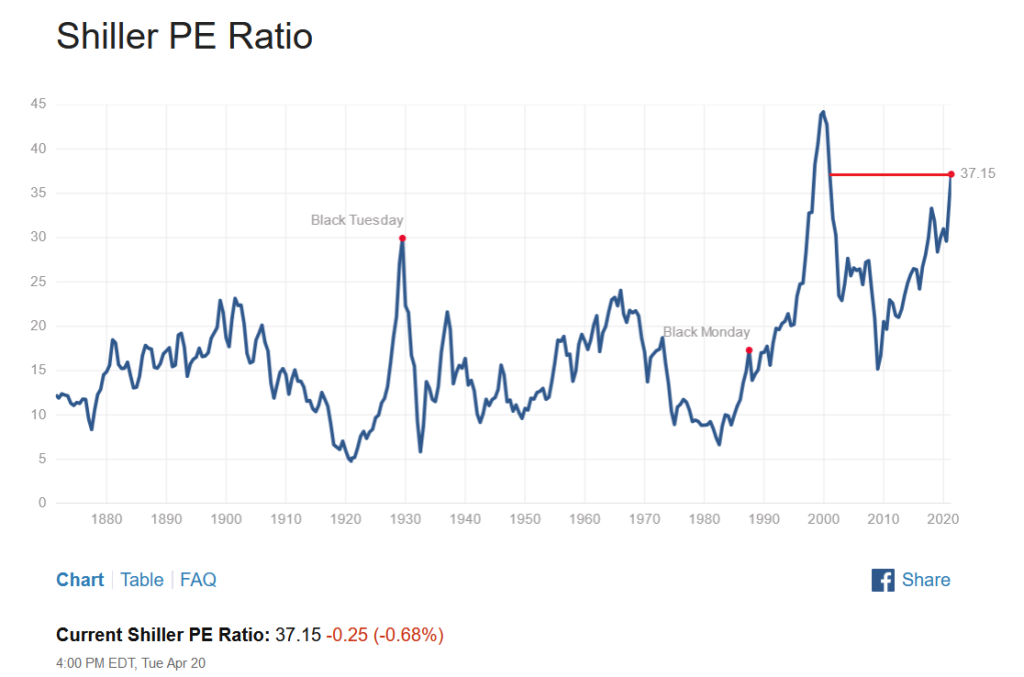
Note that the dot.com bubble of the late 1990s was seemingly detached from Fed money printing. As such, the Shiller “CAPE” ratio (cyclically-adjusted price/earnings ratio) is at its highest level since the dot.com bubble.
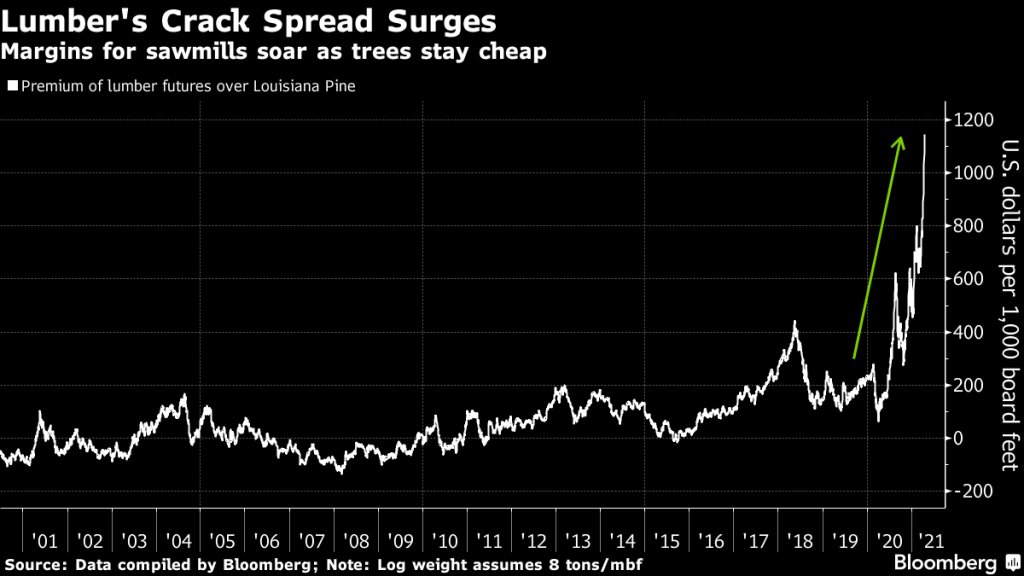
Throw on to the bonfire surging lumber prices.
Shiller’s CAPE and the Buffett Indicator are point to a massive stock market bubble.