by UPFINA
We usually don’t include quotes from investors, but these do an amazing job at measuring the market’s tone. A high yield portfolio manager at Diamond Hill Capital Management stated, “You get an invitation to a party from the Fed, Treasury and Congress — they offer to pick you up, take you home and bring you breakfast in bed the next morning.” Zox stated, “You know it is going to be a party like no other.” They are referring to the massive onslaught of junk bond offerings.
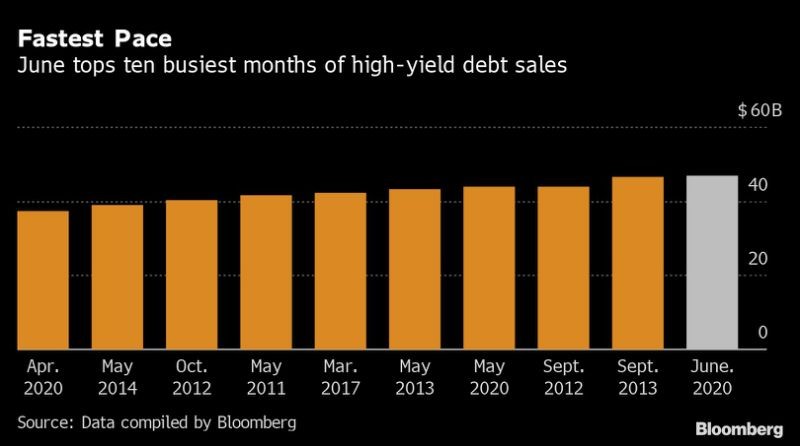
As you can see from the chart below, June has seen $46.7 billion in junk bond offerings already which surpassed the monthly record of $46.3 billion in September 2013.
Year to date, offerings have totaled $199 billion which is a 66.5% increase from last year. The Fed has allowed at risk companies to raise money. Instead of these firms going bankrupt like they usually do, they are getting a lifeline. The catch is they will have a huge debt overhang. The good news is yields are much lower than the peak in March. The economy is leaning heavily on the Fed to help it which is bad because it will be tough to reverse course. The economy becomes less dynamic if companies aren’t allowed to fail. The positive is this will be the quickest recovery ever depending on how the 2nd wave of COVID-19 progresses.
American Airlines priced a public offering of 74.1 million shares at $13.5 and a $1 billion convertible senior note which yields 6.5% and is due in 2025. Most of the airlines should survive, but retail traders will find out that doesn’t make them good investments because they are being diluted and there will be higher expenses to cover the interest on the debt.
Hangover After The Party
The party looks fun in June 2020, but it might be a long term problem. As you can see from the chart below, Oxford Economics estimates corporate debt to GDP in advanced economies could get close to 100% this year. There will be less debt issued in the 2nd half, but the problem is already here. Oxford Economics believes this high corporate debt level will limit economic growth. This past expansion, the consumer deleveraged. Usually in expansions, leverage increases. Now, following the quick recession, corporations are taking on more leverage which is usually when firms deleverage. Everything is backwards.
Rising corporate debt during the Global #Coronavirus Recession is in part a reflection of increased borrowing for cash flow purposes, but it could crystallize prior risks and weigh on rebound in business investment
via @OxfordEconomics @SoberLook pic.twitter.com/x6eSOaZ0bX
— Gregory Daco (@GregDaco) June 24, 2020
When will the deleveraging come? Leverage is in a long term uptrend as a percentage of GDP. Cyclical deleveraging will occur if interest rates rise; the other way is if firms get less aggressive by using their profits in the next few years to pay down some debt. The latter scenario is more likely and obviously less problematic. If rates were to spike, we would in hindsight call this a debt bubble that burst. It’s tough to call this a debt bubble because the long term fundamentals don’t suggest yields will spike as demographics are still headed in the same direction (older). In fact, if corporate debt limits growth, that will serve to pressure rates lower.
CEOs Abandon Ship
If a company’s top management all leave at once, it means the company is likely in bad shape. They clearly are speaking with their feet. In Q4 2019 and January 2020, CEOs spoke with their feet by leaving. Instead of it being at a specific company, it was all companies. It’s almost as if CEOs predicted the recession this year. Maybe, it just shows the economy was late cycle. CEOs have the easiest time leaving when the market is pleasant. Investors don’t want to see top management resigning in the middle of a disaster.
CEO departures pic.twitter.com/1MDWWAnmPs
— Sam Ro 📈 (@SamRo) June 23, 2020
As you can see from the chart above, in Q1 CEO turnover was 6% which was the highest since it started being tracked in 2002. It was intensely high early in 2020 because Q1 includes March when the trend reversed. No one wants to see a CEO leave in the middle of a pandemic. The index crashed from above 200 to 48 where it bottomed in April. It ticked up to 83 in May. As the economy gets back to normal, this index should normalize. It’s almost as if CEOs knew a pandemic was afoot and left beforehand.
Retail Traders Trade Often
This period in market history is similar to the late 1990s when retail traders quit their jobs to trade full-time. It seems like this market is in hyper speed because we went from euphoria to fear back to euphoria like the late 1990s in just about 5 months. The Fed bailed out Long Term Capital Management in 1998. This stimulus in the late 1990s led to 2 more years of a bull market in tech. It’s doubtful the Nasdaq can continue at this rate for 2 more years. The Nasdaq’s year to date outperformance over the S&P 500 and the Dow is the highest since 1983. The 14 month RSI of the ratio of the Nasdaq 100 to the S&P 500 is in the high 80s. It peaked at 90 in 2000. The Nasdaq 100 divided by the S&P 500 is higher than the peak of the tech bubble.
As you can see from the chart on the left, retail traders are heavily involved as Charles Schwab and TD Ameritrade are seeing sequential spikes in account growth. The Google searches for “day trading” have more than tripled since February. The bankrupt stocks, the airlines, and the cruise ships, have done poorly since June 8th, but the cloud stocks have done very well still. Retail traders are likely making more trades because trading fees have been eliminated at most brokerages.
Google Trend for ‘day trading’ unlike anything seen in at least 16 years pic.twitter.com/tdN5uheFl1
— Sam Ro 📈 (@SamRo) June 23, 2020
Conclusion
It’s a junk bond party as junk bond issuance this year is up 66.5% from last year. The corporate debt to GDP ratio being above 90% in advanced economies might slow growth. CEOs quit at exactly the right time in late 2019 and early 2020. It was right before the COVID-19 crisis. The Nasdaq has done extremely well versus the S&P 500 because it has almost 50% technology, while the S&P 500 has 27%. Retail traders are trading more often and are euphoric.