Wolf Richter wolfstreet.com, http://www.amazon.com/author/wolfrichter
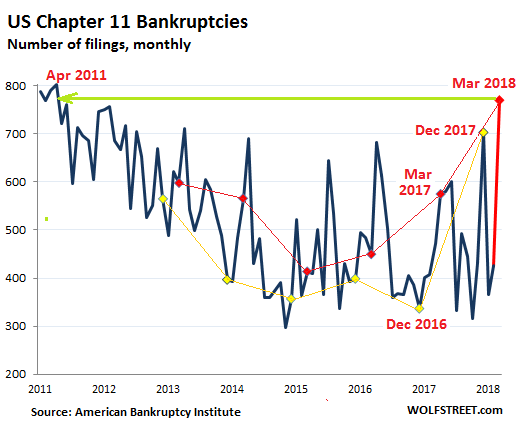
New Chapter 11 bankruptcies in the US spiked 63% year-over-year in March to 770 filings, the highest number of filings for any month since April 2011 (when there had been 789 filings as companies were still trying to emerge from the Great Recession).
This chart shows Chapter 11 filings back to 2011, based on data from the American Bankruptcy Institute. The last six Marches are marked with red dots. The year-over-year jump of 299 filings in March is the second largest year-over-year jump for any month since the Great Recession. It is behind only the jump of 366 filings last December, which had set a post-recession record. The yellow dots represent the last six Decembers (more on that in a moment):
A company files for Chapter 11 bankruptcy protection from creditors in order to try to restructure its debts under the supervision of a judge. This normally involves are large reduction in debt and the transfers of part or all of the ownership of the company from pre-bankruptcy owners (shareholders) to creditors. Most often, shareholders lose everything. Some unsecured creditors too lose everything. Secured creditors are often made whole. And many creditors in between get a haircut, in return for some ownership. The hope is that the company can “emerge” from bankruptcy with less debt and keep operating.
Bankruptcy filings are seasonal and usually peak in April, along with tax season. So the March jump doesn’t augur well for April.
The low points in Chapter 11 filings normally occur late in the year, before or in December, except last December when filings spiked 61% from November, to the highest level for any month since April 2013. In March, it got worse when Chapter 11 filings spiked to the highest level for any month since April 2011.
While the December 2017 spike was truly special, in January and February, filings were close to where they’d been a year ago, and I thought, OK, maybe December was just a blip. But now there’s the March spike, the second highest spike since the end of the Great Recession.
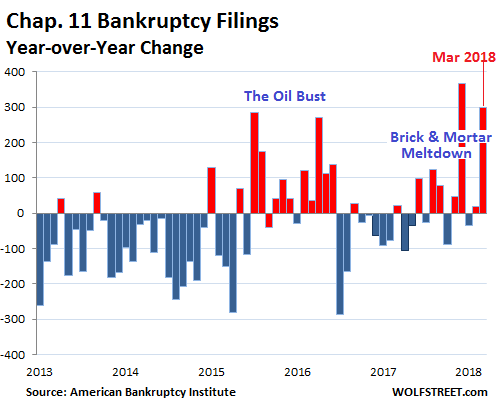
The chart below shows the year-over-year change in Chapter 11 filings. This eliminates the effects of seasonality. Red bars indicate that filings rose from a year ago. Blue bars indicate that filings fell from a year ago. Note the effects of the oil-and-gas bust in 2015 and 2016 and more recently the effects of the brick-and-mortar meltdown; but now it’s not just the brick-and-mortar meltdown anymore:
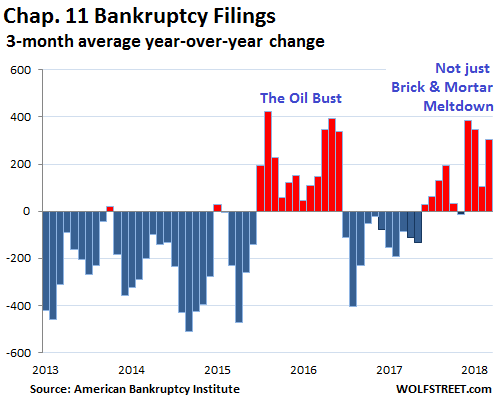
Monthly Chapter 11 filings are volatile. To smoothen out the volatility and eliminate the effects of seasonality we can look at the year-over-year changes as a three-month rolling average. For example, the three-month average year-over-year change for March is based on January, February, and March. And then the image becomes clear: There is a problem, and it’s not a blip:
The by now well-documented Brick-and-Mortar retail meltdown is responsible for part of it. Retailer bankruptcies of all sizes have been piling up in large numbers since 2016. They all started out as Chapter 11 filings, though many of them later turn into messy liquidations, like Toys ‘R’ Us.
Back on January 8, when I discussed the horrendous spike in Chapter 11 filings in December, I figured that there must have been another cause. The economy is doing OK. In Q4, it was stronger than it had been in prior years, when bankruptcies were much lower. And retailer bankruptcies alone wouldn’t cause that kind of spike. I speculated that that the advent of the new tax law had a lot to do with it.
Creditors and shareholders of failing companies knew that they could write off losses in 2017 under the old corporate tax rate of 35%, thus getting the government to pick up 35% of the tab of their losses via lower taxes. In 2018, the new tax law adds uncertainties, but shareholders and creditors knew that losses incurred in 2018 would face the new corporate tax rate of 21%, and so the government would only pick up 21% of the losses.
But in March, this logic no longer applies. So it looks like the December spike was a mix of tax consideration and a sharply deteriorating credit environment for companies.
This is a sign that the economy has arrived at the end of the “credit cycle.” The Fed is trying to push up interest rates and tighten financial conditions. Weak companies are starting to have a harder time refinancing their debts. And those that succeed face higher borrowing costs. Some sectors are getting hit harder than others, such as brick-and-mortar retail, which had a terrible March. But this is now spreading in other sectors, such as specialized subprime auto lenders.
Subprime auto-loan delinquencies have surged to the highest rate since October 1996. Scores of smaller specialized lenders have piled into this field after the Financial Crisis, some of them backed by private equity firms. Three of them have now collapsed into bankruptcy or were shut down. Allegations of fraud and misrepresentations are swirling through the bankruptcy filings. Read… Subprime Carmageddon: Specialized Lenders Begin to Collapse